Ever experienced this? You cite a source that seems reliable, and your professor suddenly questions whether it’s even academic. Finding good academic papers is essential!
Or it is academic, but you’re unsure whether you should cite a paper from the “32nd Gordon Conference on Cannabinoid Function in the Brain” or not.
In this article, I’ll reveal 5 indicators that will help you distinguish good scientific sources from less reliable ones.
Why is evaluating scientific sources so important?
Here’s an important point that many often underestimate: the quality of your sources directly influences the credibility of your arguments.
Science relies on building new knowledge on solid, verifiable information. Sources that meet scientific standards, such as undergoing a rigorous peer-review process, are essential for creating a stable foundation for your academic work.
Without reliable sources, you risk basing your arguments on uncertain or outdated information, which diminishes the perceived quality of your own research.
Choosing the right publication outlet
In most research disciplines, three types of publications have become the standard:
- Books
- Journals
- Conference papers
Choosing the right outlet can save you valuable time and effort. If you know that a journal, a conference, or a book publisher has a good reputation, you can be fairly confident that any source published there is likely reliable. At the end of this article, I’ll explain how to differentiate between a decent, average journal and a top-tier journal—so stay tuned.
Now let’s first look at the 5 general indicators.

1. The Peer-Review Process
A strong quality marker of a good scientific source is that it has undergone a peer-review process. Peer review means that a group of (usually anonymous) experts in the field has reviewed and evaluated the work before publication. They ensure that the methodology is solid, the arguments are convincing, and the results contribute to existing research. Only papers that pass this peer-review process are published.
Unfortunately, it’s not always easy to determine whether the peer-review process for a journal or conference is robust. If you see details in articles such as submission dates, how many revisions were made, and the names of the editors, that’s already a good sign.
Peer review takes time. If you see a journal article that was submitted three months before publication, that’s a sign the peer-review process may not be very thorough.
If you come across platforms like arXiv or SSRN, be aware that articles listed there have not yet undergone a peer-review process. These are called “preprints.” Preprints have the advantage of sharing the latest research with the world quickly, but they may still contain errors. So, be cautious about citing preprints.
It’s best to combine multiple indicators. Let’s take a look at a few more.
2. The Number of Citations for an Article
The citation count shows how often other researchers have used an article as a source. A high number of citations indicates that the article is considered important or groundbreaking in its field. If there are hundreds of citations, that’s already a strong signal.
However, it’s worth taking a closer look: an article isn’t always widely cited because of its quality. Some articles are cited because they’re groundbreaking, while others may be cited because they’re controversial or even flawed. Therefore, you should always view the citation count in context and distinguish good from bad citations.
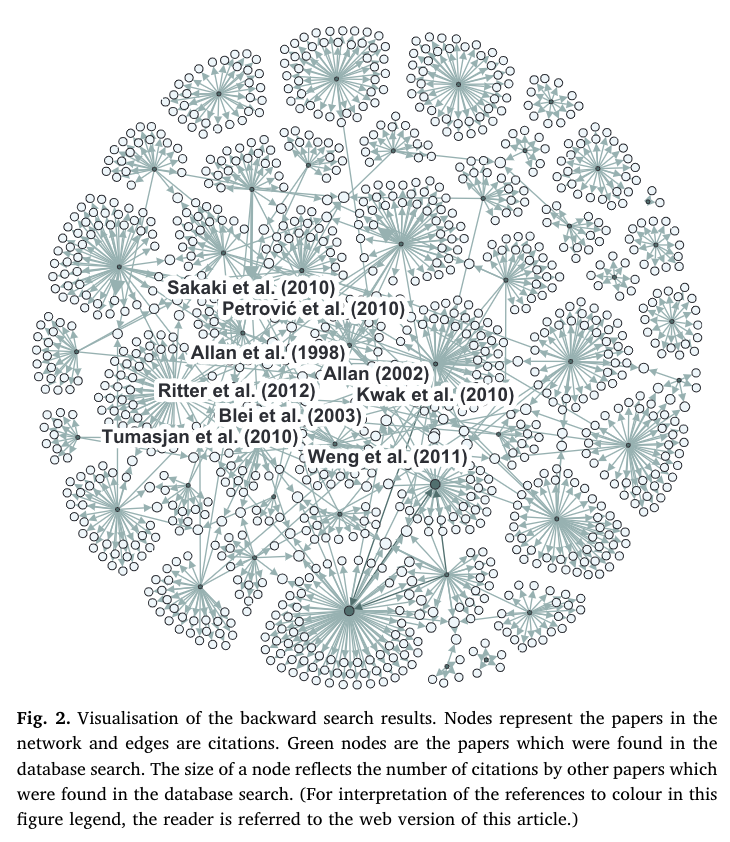
Platforms like Google Scholar or Scopus can provide insights into an article’s citations. For example, if the articles citing your original article are also frequently and positively cited, that’s a good sign. This technique is also known as “citation chaining.”
However, there are also journals and publishers that exploit this and play a dirty game with citations. They attempt to artificially generate citations to boost their journal’s reputation. You can gauge how often a journal is cited by looking at its Impact Factor.
3. Impact Factor
The Impact Factor shows how often articles in a journal are cited on average—typically over the past two years. A high value indicates that the research published there receives a lot of attention and is considered relevant. The Impact Factor is calculated by dividing the total number of citations for articles from the last two years by the total number of articles published. For example, a journal with an Impact Factor of 5 means that, on average, each article was cited five times.
In dynamic fields like medicine or natural sciences, a high Impact Factor is often considered a sign of quality and influence. However, the Impact Factor has its limitations. In specialized fields where fewer articles are published and cited, the value is often lower, even if the journal’s research is high-quality.
There are also cases where the Impact Factor is artificially inflated through “citation cartels.” In these cases, researchers frequently cite each other’s work within the same journal to boost its Impact Factor. The open-access publisher MDPI, for instance, has been criticized for high citation rates driven by internal citations. If you encounter unusually high citation counts in such a journal, it’s worth taking a closer look at the citation sources.
4. Timeliness of a Source
The timeliness of your sources is critical, especially in rapidly evolving fields like computer science. New findings and technologies can quickly render older studies less relevant. To ensure your sources are up-to-date, aim to use materials that are no more than 3-5 years old when presenting the current state of research. Of course, when addressing groundbreaking studies or theories, older sources are indispensable.
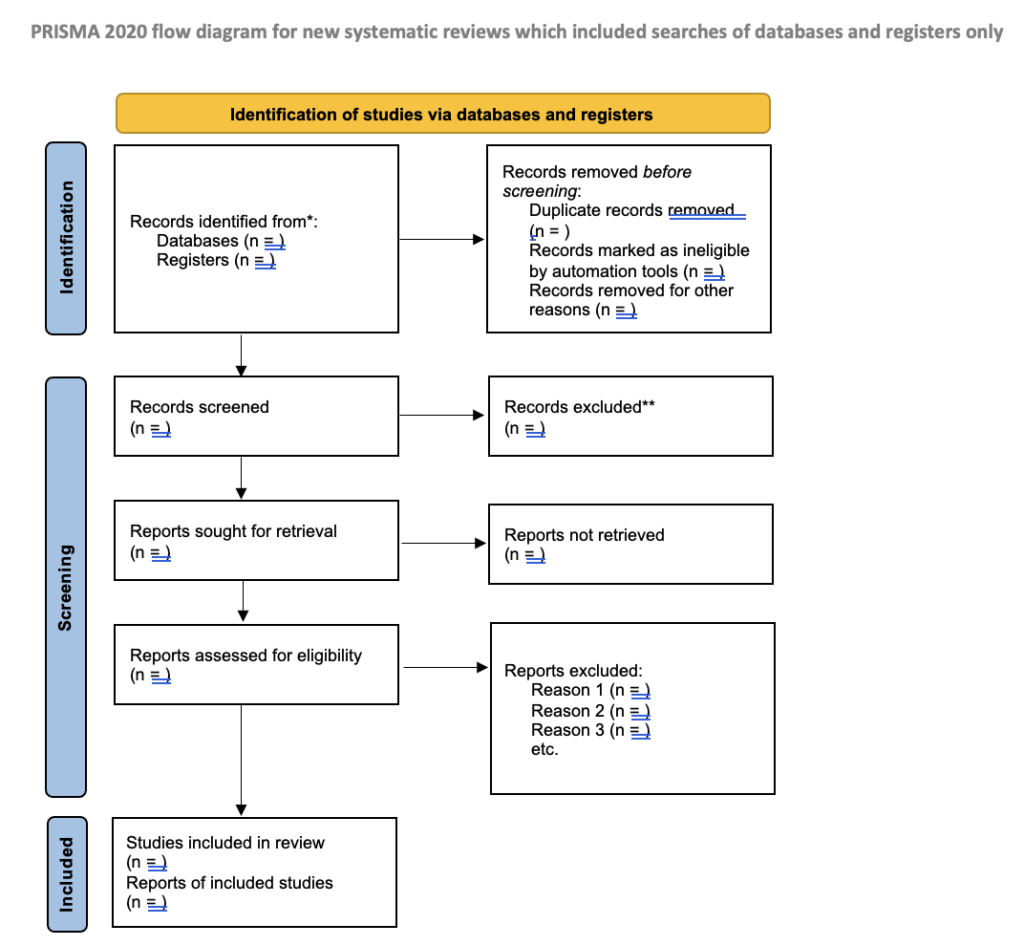
Using outdated sources in your introduction or current state of research not only weakens your arguments but can also lead to relying on obsolete approaches. This is especially important for empirical studies: an experiment conducted in the 1980s might yield entirely different results if reevaluated with modern methods. Current literature reviews and systematic reviews provide a comprehensive overview of the state of research and help you weed out outdated sources.
5. Open Access and Paid Access -Finding Good Academic Papers
Scientific articles are not always freely accessible. There are two main ways to publish academic articles:
- Open Access: These articles are freely accessible and cost-free, often available through platforms like PubMed, DOAJ, or directly on journal websites. The advantage is that they’re immediately and freely available—ideal for students and researchers without access to expensive databases. Many universities are increasingly promoting Open Access to facilitate access to research.
- Paid Access: Articles in high-ranking journals, particularly Q1 journals, often require payment. These articles are usually behind a paywall and may require a per-article fee or access via a university subscription. Many institutions provide access to such articles through databases like Elsevier, Springer, or JSTOR, allowing students to access them at no additional cost.
Bonus: Journal Rankings
The simplest and cross-disciplinary ranking system for finding good academic papers is the quartile classification (Q1 to Q4). This helps you compare journals within their respective fields. Q1 journals (the top 25%) are among the most cited and respected publications.
In each discipline, there are also specialized journal rankings to guide you. Let’s take business administration as an example. Here, you’ll find specific rankings that help you identify high-quality journals and assess their reputation. These rankings are invaluable when it comes to finding good academic papers.
- FT50 – Financial Times 50 Ranking: This internationally recognized ranking is used by many MBA programs to assess the quality of research in business-related fields. The journals listed here are the best across all subfields of business administration, from marketing and management to human resources.
- UT Dallas List: This list is even stricter, including only 24 of the world’s leading business journals. Journals on this list place the highest value on academic quality and scientific rigor. Citing articles from these journals demonstrates that you’ve engaged with the very best academic literature.