Categories
Uncategorized

How to Create a Codebook in Qualitative Research

Are you looking for a quick yet precise guide on how to create a codebook for your next qualitative research project?

Then you’ve hit the jackpot with this article!

In this post, I’ll explain what a codebook is (in case you’re unfamiliar with it), guide you step by step through the creation process without overwhelming you, and even share how you might be able to skip most of the effort altogether while improving the validity of your qualitative data analysis.

What is a Codebook?

Before we dive in, let’s clarify that we are discussing codebook creation within qualitative research. That means that the data you will be analysing can be interview transcripts, documents, reports, videos, social media postings, and so on.

A codebook is essentially a coding manual that provides structured guidelines for assigning categories which represent broader thematic groupings to units of analysis within a qualitative dataset. Each category or theme consists of specific codes, which serve as labels for classification.

Using a codebook is more common in research projects that analyze qualitative data, but do so from a more quantitative perspective. I’ll explain what this means in a second.

In “hardcore” interpretive qualitative studies, for example when using Glaser’s grounded theory approach or Braun and Clarke’s reflexive thematic analysis, a codebook can also be used—but its purpose here is a little different.

Let’s start with the “quantitative” way of analyzing qualitative data. This is done in methods such as quantitative content analysis or deductive thematic analysis. I’ve made tutorials for both of these methods, so please feel free to check them out.

In a quantitative content analysis, you assign small bits of your qualitative data to certain categories. In the case of this method, you do not develop these categories yourself. Instead, you define them prior to your analysis. And how do you do that?

With a codebook!

The codebook contains all categories and descriptions of the categories, specifying how units of analysis (e.g., sentences, tweets, or images) should be classified.

The codebook may also define a numerical value (an ID) that you can assign per category: Category 1, category 2, category 3, and so on.

Example of a Codebook

Let’s look at a concrete example to make this clearer. Imagine we want to analyze tweets about COVID-19, specifically focusing on misinformation as part of our research question.

A codebook designed for this study would need to contain various categories of misinformation commonly found on social media.

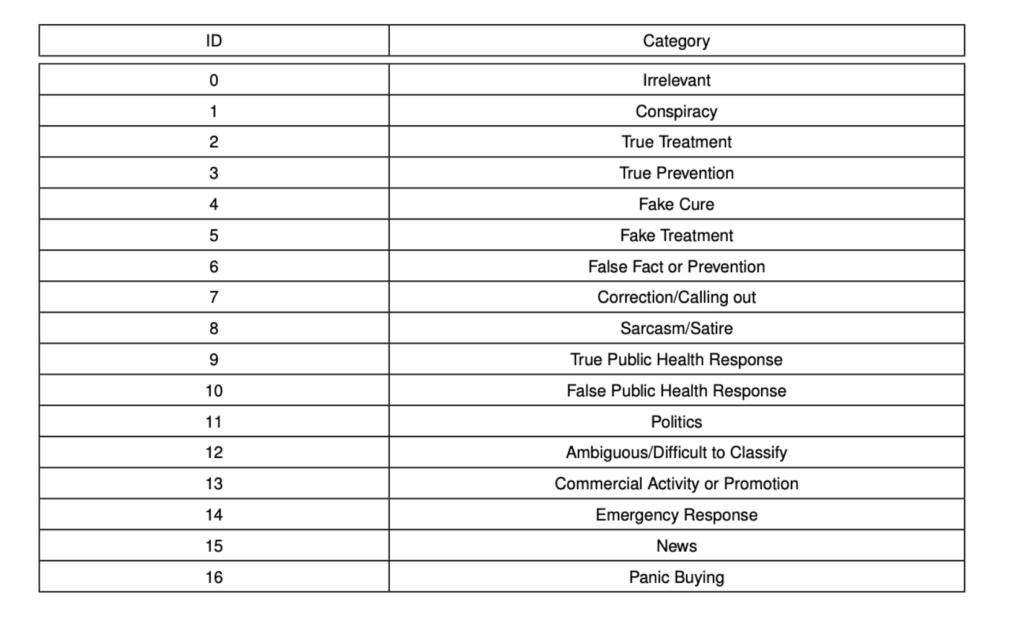
Here’s an example from an actual codebook by Memon & Carley (2020):

The authors defined 16 categories into which they classified their material.

For each category, the codebook provides:

  • A detailed description
  • Examples
  • Justifications for why a particular example was classified under that category

Creating Your Own Codebook

You should only create a new codebook if, after thorough screening of the literature, you can’t find an existing one that suits your study or can be adapted to your needs.

Structure of a Codebook

A codebook, much like a scientific paper, should be well-structured for clarity. If necessary, include a table of contents for easy navigation.

Here’s a suggested structure:

#1 Introduction

A brief paragraph explaining:

  • The context in which the codebook was developed
  • What it is suitable for
  • Whether it builds upon an existing codebook (if so, specify which one)
  • The dataset used to develop the codebook

#2 Overview of Categories

Include a table summarizing all categories. Sometimes a codebook could have two levels, with categories and subcategories or main codes and sub-codes. Whether you call it codes, categories, or themes depends on the method. In content analysis researcher typically refer to categories, in thematic analysis it’s themes and so on. This means, if you are creating your own codebook, you should stick with the vocabulary of the method you want to apply the codebook to.

#3 Description of Categories

Categories can originate in two ways:

  1. From existing literature or a previously established codebook
    • In this case, provide the citation.
  2. Developed based on your own dataset
    • If you identify a new category during your analysis, you can add it to the codebook.

Each entry in the codebook should consist of:

  1. Title of the Category
  2. Description in your own words, explaining what the category represents and the conditions under which this category applies
  3. Corresponding sub-categories that might be part of this category and what they represent
  4. Unit of analysis (e.g., tweet, comment, video, text snippet)
  5. At least one example (preferably several) from a real dataset
  6. Explanation of why the example(s) were assigned this category or sub-category

For points 5 and 6, you can use a table format similar to the linked example. The key is to keep the codebook as clear and structured as possible for ease of use.

#4 References

Finally, list all sources used in your codebook, just as you would in any scientific work.

create a codebook 2

Using an Existing Codebook

Creating a new codebook from scratch can be time-consuming. That’s why it’s worth checking for existing codebooks first.

Where to Find Existing Codebooks

  1. Open-Science Databases: Many researchers share datasets and resources, including codebooks, to support the academic community. Examples:
    • Zenodo
    • OSF (Open Science Framework)
  2. Contacting Authors: If a paper references a codebook but doesn’t provide it in an appendix, try emailing the authors. Researchers often appreciate interest in their work and may be happy to share their codebook.
  3. Adapting a Codebook: If you find a relevant codebook, you can modify it to fit your study. However, make sure to cite the original source and document any changes you made. If you include your adapted codebook in an appendix, provide a detailed explanation of modifications.

Codebooks in Inductive Qualitative Research

In the beginning, I mentioned that codebooks may also be used in inductive qualitative research, such as Glaserian grounded theory or reflexive thematic analysis.

The main difference here is that you are not looking for pre-defined categories. Instead, you start with a blank canvas and create all categories based on your data. The codebook is simply a tool to document your categories. This will help you and others (such as collaborators or reviewers) to better understand how the categories were built. You are essentially creating a documentation of all your categories and examples. But in contrast to quantitative content analysis and deductive thematic analysis, you are doing it during and after the analysis rather than before.

Final Thoughts

A well-structured codebook is essential for conducting research that aims to assign qualitative data to predefined categories or themes.

Whether you create one from scratch or adapt an existing codebook, being systematic, clear and consistent is key to ensuring valid and replicable results.

Categories
Uncategorized

Quantitative Content Analysis (7-Step Tutorial)

You’ve been trying to figure out quantitative content analysis, but no matter where you look, all you find are books, papers, and information on qualitative content analysis.

Help is on the way.

Quantitative content analysis often takes a backseat to its qualitative counterpart, receiving only a brief mention in methodology books. However, if this is the method you want to apply, you require more guidance. And that’s exactly what you’ll get here.

In this article, you will learn how to conduct a quantitative content analysis in seven steps and understand the key differences from qualitative content analysis.

Quantitative vs. Qualitative Content Analysis: The Key Differences

Quantitative content analysis traces back primarily to a methodology book by social psychologist Bernard Berelson. He defined content analysis as a “research technique for the objective, systematic, and quantitative description of the manifest content of communication” (Berelson, 1952, p. 489).

Note: This definition applies to content analysis in general, not just the quantitative approach. Naturally, this sparks debate, as the very term “quantitative” can provoke strong reactions from advocates of the qualitative research paradigm.

The subject matter of content analysis—whether qualitative or quantitative—is always somehow qualitative in nature. That is because content analysis helps us evaluate qualitative data sources, such as newspaper articles, films, social media posts, or documents. But the method itself is heavily informed by the quantitative paradigm, as its name suggests.

Quantitative content analysis systematically converts qualitative material into quantifiable data by applying structured coding schemes and statistical methods. We’ll explore how that works shortly.

Both quantitative and qualitative content analysis aim to systematically and objectively evaluate content. However, a key distinction is that the quantitative approach allows for greater intersubjective traceability, as it follows a structured and replicable coding process.

While qualitative content analysis relies more on the researcher’s judgment and interpretative creativity, quantitative content analysis follows a strict set of rules. It is designed to test theories by verifying hypotheses rather than generating new ones.

Let’s look at the 7 steps of applying quantitative content analysis.

Step #1: Theoretical Preparation for Quantitative Content Analysis

As with any research project within the quantitative paradigm, engaging with existing theories is crucial. Start by defining your research problem—what exactly do you want to investigate?

Ideally, your problem should focus on the relationship between variables that you can examine through content analysis. For example, you might study “news framing” related to climate change and the “emotions” in social media discussions.

Before conducting your quantitative content analysis, formulate hypotheses—testable assumptions about the relationships between variables. A strong hypothesis clearly defines the dependent and independent variables and ensures that the coding categories reflect these constructs. For example, in a study on climate change news framing, you might hypothesize that news articles from government-funded media use the ‘scientific consensus’ frame more often than private news outlets. Another example: “Climate change news framing (independent variable) influences the emotional responses of social media users (dependent variable).”

For a deeper dive into hypothesis formulation, check out my dedicated tutorial on the topic.

Step #2: Sampling

Now, you need to determine your sample. Suppose you want to analyze how climate change is framed in social media. Your sample could consist of a random selection of 500 tweets from major news outlets (e.g., BBC, CNN, Reuters) over the past six months.

Ensuring that the sample is representative is crucial, for example, by balancing sources from different political perspectives. A quantitative content analysis typically allows for a bit of a larger sample because breadth is more important than depth. For a qualitative content analysis, it’s the exact opposite.

Step #3: Defining the Unit of Analysis

At this stage, you specify the level at which your material will be analyzed. For example, if you are studying how climate change is framed in tweets, your unit of analysis could be (1) entire tweets, (2) individual hashtags, or (3) specific phrases related to emotions (e.g., ‘climate crisis’ vs. ‘climate hoax’). If you’re analyzing a text, the unit could be a full sentence or individual words, depending on your research objective.

If you’re looking for semantic nuances, such as emotional tones, it might make sense to analyze individual words. If you’re investigating broader themes, like news “frames,” analyzing entire sentences or text sections may be more appropriate.

Step #4: Defining Descriptive Categories

Before starting the analysis, you need to establish categories for classifying your units of analysis. This involves researching existing coding manuals or codebooks in the academic literature. If none suit your purpose, you must develop your own.

For example, in a study on news framing, a coding manual would list various frame types such as ‘scientific consensus,’ ‘economic impact,’ or ‘conspiracy theory’ and provide instructions for assigning sentences, tweets, videos, or images to these categories.

Authors of coding manuals typically include example cases and detailed coding guidelines, ensuring clarity and consistency. Think of the coding manual as a structured guide for analysis, whether for your use or for others replicating your study.

If you’d like me to create a video on how to develop a coding manual, let me know in the comments!

Quantitative Content Analysis

Step #5: Quantification

Once you’ve assigned each unit of analysis to a category, count how often each category appears in your sample. For example, if analyzing 500 tweets, you might find that 40% frame climate change as a ‘scientific consensus,’ while 25% present it as a ‘conspiracy theory.’ These frequencies allow for statistical comparison and further quantitative analysis.

The most common technique for evaluation is frequency analysis, which links category occurrences to the variables under investigation.

According to Krippendorff (1980), key techniques in quantitative content analysis include frequency analysis, contingency analysis, and cluster analysis. He emphasizes that quantitative content analysis must ensure reliability through systematic coding procedures and validation techniques. These methods help uncover statistical patterns while ensuring measurement validity and intercoder reliability.

A crucial aspect of any quantitative content analysis is ensuring reliability and validity. Intercoder reliability should be tested using Krippendorff’s Alpha or Cohen’s Kappa to ensure that different coders classify content consistently. Without strong reliability, the statistical findings of the analysis may not be meaningful.

If you are doing the analysis by yourself, you cannot calculate intercoder reliability. For this case, you may look into “intracoder” reliability.

Step #6: Statistical Analysis

Statistical analysis can be either descriptive (e.g., frequency distributions, cross-tabulations, means, and standard deviations) or inferential, depending on the dataset size. Inferential techniques include regression models to test relationships and factor analyses to identify underlying patterns in large datasets. Descriptive statistics summarize patterns within the data, while inferential techniques, such as regression models, examine relationships between variables. Factor analyses can identify latent patterns in large datasets, while contingency analysis tests the association between different categorical variables. For example, contingency analysis can reveal whether certain frames are more common in specific media sources, while a regression model can test how media framing influences audience perceptions.

For meaningful results, your categories must be clearly operationalized and directly related to the variables under examination. Thus, problem formulation, hypothesis generation, and category selection should be well-aligned.

Step #7: Presenting the Results of Quantitative Content Analysis

When reporting your results, tables are your best friend. First, present the absolute frequencies of your categories and describe them in your own words.

Next, outline the results of your statistical tests, explaining why you chose them and what the findings mean.

Finally, state which of your hypotheses were supported and which were rejected.

Conclusion: Why Choose Quantitative Content Analysis?

Quantitative content analysis is an excellent choice when you want to test an exisintg theory or framework with qualitative data. Some research questions cannot be effectively addressed through traditional quantitative methods like surveys or experiments. In such cases, content analysis provides a valuable alternative.

If this sounds like what you’re looking for—then quantitative content analysis is the right method for you!

Literature on Quantitative Content Analysis

Berelson, B. (1954). Content Analysis. In G. Lindzey (Ed.), Handbook of Social Psychology. Vol. 1: Theory and Method (pp. 488–522). London: Addison-Wesley.

Krippendorff, K. (1980). Content Analysis: An Introduction to Its Methodology. Sage Publications.

Categories
Uncategorized

Participant Observation (Research Method Explained)

What is participant observation? Where does this research method originate? In which cases is it used? And most importantly: How can you successfully conduct this method yourself, which has sometimes been called “the last great adventure of social science” (Evans-Pritchard, 1973)?

If these questions matter to you, then you’re in the right place. Grab a drink, sit back, and enjoy this article as a smooth introduction to your own ethnographic adventure.

Ethno…what? Don’t worry, we’ll get to that.

Ethnographic Research

Participant observation is a core method in ethnographic research, often simply referred to as fieldwork. The aim is to gain insights into human behavior, group dynamics, and social interactions.

The subject of study can range from an indigenous tribe in Papua New Guinea to a tech startup in a small town in Germany.

The word “ethnos” comes from ancient Greek and roughly means “foreign people.” This research approach has its roots in anthropology and ethnology. Historically, it was used in expeditions to remote regions or isolated islands to study the people, tribes, and cultures living there. Today, ethnographic methods are widely used in various disciplines, including sociology, education, social psychology, and even business studies.

Observation

Observation is probably the most well-known method in ethnography. Spradley (1979) describes it in very simple terms:

“I want to understand the world from your point of view. I want to know what you know in the way you know it. I want to understand the meaning of your experience, to walk in your shoes, to feel things as you feel them, to explain things as you explain them. Will you become my teacher and help me understand?”​

If you have developed a research question that can be answered by describing the behavior of individuals in their natural environment, then observation is a suitable method. By observing, you can see with your own eyes what you aim to study.

In contrast, methods like expert interviews or surveys require you to rely on participants’ statements being accurate and honest.

As a result, observation is one of the empirical methods where researcher subjectivity plays the largest role. Subjectivity is common in qualitative research, but in observation, it is even more pronounced, as everything is filtered through the researcher’s own perceptions and senses.

Non-Participant Observation

In non-participant observation—just as the name suggests—you remain an outsider, merely watching without engaging in the activity. Besides the distinction between participant and non-participant observation, another key factor is whether the observation is overt or covert.

In overt observation, you ask for permission beforehand, introduce yourself, and explain why the study is being conducted and how it might be beneficial for the participants.

Covert observation, on the other hand, takes place without the knowledge of those being observed. While this might yield highly authentic insights, it is rarely used—and for good reason. Ethically, covert observation is highly problematic and would have difficulty passing an ethics committee review.

participant observation

Participant Observation

The “participant” aspect of participant observation refers to the extent to which you, as the researcher, are involved in the situation. There are different roles you can take on.

Gold (1958) identified four different roles that researchers can assume in participant observation:

Complete participation

When you are already a full member of the group you are studying, such as when you observe a company where you work as a student assistant.

Active participation

When you try to engage in the same activities as the group members but are still an outsider.

Moderate participation

When you alternate between observing and participating to maintain a balanced approach.

Passive participation

When you are present but do not engage in the activities, interacting minimally with the group.

For example, if you were studying an indigenous tribe in the Amazon, you might actively take part in a spiritual ritual. This would make you highly involved in the experience, possibly giving you access to insights and conversations you might not otherwise have. This would be considered active participation. Alternatively, you could just follow along quietly, staying in the background while smiling and clapping along—this would be passive participation. In non-participant observation, you would avoid any interaction altogether.

However, active participation also has a significant drawback: the people you observe may alter their behavior simply because you are participating. This effect must always be considered and critically discussed.

Additionally, you can conduct conversations with participants. These ethnographic interviews are quite different from structured expert interviews. There is no pre-defined questionnaire; instead, conversations occur naturally within the setting. The goal is to build a respectful and trusting relationship. These interactions might take place around a campfire outside usual working hours or in an unexpected setting. Instead of recording the conversation, you take notes and later document your insights in a research diary.

The Three Phases of Participant Observation

To help you prepare for your participant observation, here are three key phases that this method can be divided into (Spradley, 1980; Flick, 2019):

Describing the Research Environment

At the beginning of your participation in a group, you are an outsider and need time to acclimate. Your presence is something new for the group members, and they must adjust to having you around. During this phase, it is advisable to remain somewhat in the background and start by thoroughly documenting the environment. Write down everything you observe—what you see, hear, and experience. Simultaneously, take the opportunity to introduce yourself and gradually establish rapport with individual members.

Focused Observations

Once you have become an accepted presence within the group, you can transition to more purposeful observations. At this stage, you can initiate targeted conversations and immerse yourself in situations that directly contribute to answering your research questions. Your observations become more structured as you begin to refine the focus of your study.

Selective Observations

In the final phase of your study, you will have already gathered significant insights and formulated preliminary answers to your research questions. Now, your objective is to seek out specific examples and supporting evidence that substantiate your findings. This phase requires critical thinking and a keen eye for patterns and consistencies in behavior.

participant observation shribe

Data Collection and Analysis in Participant Observation

When it comes to collecting data, you can take either a structured or unstructured approach. If you have created checklists, formulated guiding questions, or prepared other documentation in advance, you are following a structured approach.

Conversely, if you enter the observation setting with an open mind and an empty notebook, allowing observations to guide your documentation process, your approach is unstructured. Both methods have their advantages and limitations.

Your research diary plays a crucial role in the analysis process. Alongside taking notes during your observations, you should later expand on them in your diary, adding reflections and interpretations. To ensure that you do not overlook documentation, consider setting aside dedicated time—perhaps a few hours or an entire day—away from the field to write down your impressions in detail.

After data collection, qualitative analysis techniques can be applied to make sense of the findings. Common methods include:

  • Thematic Analysis: Identifying recurring patterns, themes, and categories within the observational data.
  • Coding: Assigning labels to different aspects of the data to systematically organize insights.
  • Narrative Analysis: Examining how observed interactions and behaviors construct meaning within a specific social context.

These approaches help translate raw observations into meaningful interpretations, allowing you to draw conclusions from your study.

Now, lace up your boots and embark on your research adventure!

Categories
Uncategorized

What is a Histogram? (Statistics Basics)

What is a histogram in statistics? How does it visualize data? And how can this visualization help you with data analysis?

In this video, I’ll show you how to ace your next statistics exam and take your data analysis to the next level using histograms.

Histograms are a standard tool in statistics and are essential for many academic papers. To help you understand and use histograms effectively, I’ll walk you through the basics today.

Of course, I’ll also show you how to create a histogram for any dataset in no time.

1. What is a Histogram?

A histogram is a type of chart that represents a frequency distribution. As you can see in the graphic, the x-axis represents intervals, while the y-axis shows their corresponding frequencies.

A key characteristic of a histogram is that the bars are directly adjacent to one another, with no gaps in between. This emphasizes the continuous nature of the data, as each bar represents a range of values rather than discrete categories. This is because histograms are used for continuous data (e.g., measurements like weight, length, or time spans).

In contrast, bar charts represent categorical data (nominal data such as the number of students in different study programs like law, psychology, or business administration). That’s why bars in a bar chart are separated from each other.

It’s also crucial that the y-axis of a histogram starts at a frequency of 0. The height of each bar represents the number of data points in that interval.

If the baseline is altered, the perceived heights of the bars change, potentially distorting the actual distribution of the data. This could lead to an overestimation of low frequencies or an underestimation of high frequencies.

histogram statistics

2. Where Are Histograms Used?

Histograms are widely used across various fields. In economics, for example, they help analyze income distribution across different demographic groups. In medicine, they assist in understanding the distribution of measurements like blood pressure or BMI within a population.

They are also crucial for fundamental statistical data analysis, such as checking whether a dataset follows a normal distribution.

3. Creating a Histogram in Statistics

Let’s create a histogram using a real-world example. We have a dataset of exam scores from the last statistics test:

53, 41, 71, 91, 99, 93, 87, 74, 97, 81, 85, 89, 78, 61, 66, 71, 86.

First, you need to create a frequency distribution table and group the scores into intervals.

The intervals must have equal width, ensuring that all bars are the same size. If the intervals are too wide, important details might be lost, whereas too narrow intervals could make the chart too complex. For this example, I’ve chosen intervals of 10 points each (40-49, 50-59, 60-69, etc.).

In statistics, class intervals for histograms are typically chosen so that the lower boundary is inclusive, and the upper boundary is exclusive.

This means that an interval of 60-69 includes all values from 60 up to but not including 69. If we instead used an interval of 60-70, the value 70 would belong to two intervals (both 60-70 and 70-80), leading to ambiguity. To avoid this issue and ensure a clear, unambiguous assignment of data points to intervals, histogram intervals do not overlap.

Now let’s look at the frequencies.

  • One student scored in the 40-49 range.
  • Another student scored between 50-59.
  • Two students scored between 60-69.
  • Four students scored between 70-79.
  • And so on…

Now, you need to plot this data using software like Excel or R. The result for our example looks like this:

4. Understanding a Histogram in Statistics

Interpreting a histogram in statistics is a crucial step in understanding your collected data. A histogram provides a visual representation of how data is distributed.

It helps identify patterns and anomalies that may indicate specific trends or issues. Keep in mind that in density histograms, probabilities are represented by the area of the bars, while in frequency histograms, the bar height indicates the number of observations in each interval.

1. Data Distribution

Histograms show the frequency of data within different intervals, making it easy to assess distribution at a glance. Researchers can quickly determine whether the data is normally distributed, skewed left or right, or exhibits other patterns like bimodal distributions.

A normal distribution, often called a bell curve, means that most data points cluster around a central value, with symmetrical tails extending on both sides. In a university setting, this could represent exam scores, where most students achieve average marks, while very high or very low scores are less common.

A skewed distribution indicates that the data is asymmetrically spread. A positively skewed (right-skewed) histogram shows a concentration of low values with a few high values—such as the time students spend studying for a subject. Many may spend only a little time, while a few invest a lot. A negatively skewed (left-skewed) distribution suggests the opposite.

A bimodal distribution, featuring two peaks, may indicate the presence of two distinct groups. For example, in a class attended by both first-year and advanced students, two peaks might suggest that each group tends to score differently.

2. Identifying Anomalies

Visualizing data can reveal outliers, unusual patterns, or anomalies that may warrant further investigation. The width of the intervals shows how data is grouped.

  • Narrow bars indicate a detailed distribution.
  • Wider bars provide a more generalized overview.
  • Bar height represents the number of observations in each interval—taller bars indicate higher frequencies.

3. Comparing Datasets

Histograms allow for easy comparison of two or more datasets. You can use them to examine how data is distributed under different conditions or across different groups.

4. Hypothesis Testing

Histograms can help formulate or test hypotheses about data. For example, if you hypothesize that a particular variable follows a normal distribution, a histogram in statistics can confirm or disprove this assumption.

5. Decision-Making

In practice, such as in quality control, histograms are used to determine whether a business process meets specific specifications.

5. Interpreting Our Example Histogram

To better understand a histogram in statistics, I’ll now pose a few questions about our example. Feel free to pause and try answering before checking the solutions.

  • Would you say the data is symmetric, or is it skewed left or right?

You can see that the taller bars are on the left side. This suggests a left-skewed distribution, meaning the data has negative skewness. In other words, students scored relatively high in this exam.

  • What is the mode of this dataset?

The mode is the interval with the highest frequency. In this case, most students scored between 80 and 89, making this the mode.

  • How many students scored up to 69 points?

Adding the first three bars: 1+1+2 = 4 students scored up to 69 points.

  • How many students scored at least 80 points?

Adding the last two bars: 5+4 = 9 students scored at least 80 points.

  • How many students scored between 60 and 89 points?

Adding the middle bars: 2+4+5 = 11 students scored within the intervals 60-69, 70-79, and 80-89.

6. Histograms and Probabilities

Histograms help navigate large datasets. These visual representations display probability distributions, which are essential for understanding a dataset’s dynamics.

Returning to our exam example: the bar heights indicate how many students fall within specific score ranges. But they also reflect the probability of a randomly selected student achieving a particular result.

A clustering of values around a central score suggests a normal distribution, which many statistical tests assume. The histogram helps determine whether this assumption holds or if another testing approach is needed.

Histograms also allow us to infer conclusions about an entire population from a sample, provided that the sample is representative and sufficiently large. For instance, a histogram of a class’s exam scores can provide insights into the performance of all students in the program.

All in all, a histogram is like a Swiss Army knife in a statistics. If you want to dive deeper, I highly recommend Andy Field’s book Discovering Statistics.

Categories
Uncategorized

Discourse Analysis Simply Explained (Foucault, Method, Examples)

Do you want to conduct a discourse analysis for your academic paper but feel confused by all the overly complicated explanations of this method?

In this video, I’ll answer the three most important questions about discourse analysis:

  1. What is a discourse, and how can this concept be understood?
  2. How do you conduct a discourse analysis step by step?
  3. What are some examples of discourse analysis?

By the end of this article, you’ll know exactly how to proceed to turn your discourse analysis into a structured academic paper.

What Is a Discourse?

To answer this question, there’s no avoiding the work of the French philosopher Michel Foucault (1926–1984). Foucault was a fascinating thinker who, alongside many other ideas and theories, significantly developed the concept of discourse.

For Foucault, “discourse” refers to all forms of statements, such as texts, terms or concepts, that circulate within a society and shape public dialogue about a particular topic. Discourse defines not only the language, but also the way society thinks about that topic.

From this arise unwritten rules about how the topic is discussed and what might be considered taboo. Ultimately, discourse even determines whether and how actions are taken in relation to that issue.

Examples from Foucault’s Work

One example from Foucault’s early work is the discourse surrounding mental illness—or, as he called it, madness. He analyzed when and how society began labeling individuals as insane and what was considered “normal” or “abnormal” behavior. It’s shocking to see how little it once took to be deemed insane and excluded from society.

Over time, these boundaries have shifted, and psychiatric care is no longer relegated to hospital basements.

Later, Foucault also analyzed discourses surrounding sexuality, yielding equally fascinating results. Discourse analysis almost always addresses topics that have significant societal relevance or explosive potential.

Discourse Analysis

Discourse Analysis: Knowledge and Power

Another key point to remember: Foucault realized that discourse always involves knowledge and power. Power influences discourse—not necessarily in a positive or negative way, but in ways that must be considered.

  • Power: A discourse analysis must take into account who participates in the discourse, why they do so, and what interests they represent in trying to shape it.
  • Knowledge: A discourse develops over time and contributes to an increasingly sophisticated understanding. For instance, society once knew very little about the causes of mental illness, but today’s discourse reflects a far more nuanced perspective.

Foucault conducted his discourse analyses through linguistic deconstruction and reconstruction. However, his approach did not result in a reproducible scientific method.

To conduct a discourse analysis that meets modern academic standards, we need to look at how this method has been further developed.

Discourse Analysis as a Scientific Method (5 Steps)

Much like thematic analysis or the grounded theory approach, discourse analysis has been refined and expanded by many scholars. For simplicity, we’ll focus on the work of Reiner Keller, who wrote a whole book on discourse analysis and the different approaches to it.

Keller’s book The Sociology of Knowledge Approach to Discourse (2011) should be at the top of your reading list if you’re planning to conduct a discourse analysis.

A discourse analysis isn’t some vague or overly abstract process—it follows the same principles as other qualitative methods in empirical social research. In fact, it often uses many of the same components, as we’ll see in a moment.

Here’s Keller’s 5-step process:

#1 Formulating Research Questions

The research question for a discourse analysis is no different from any other research question. However, it must be framed so that discourse analysis is the logical methodological choice to address the question.

Example Research Question:
How is climate change being discussed in political discourse in the United States?

#2 Conducting a Literature Review

Next, as with any academic work, you’ll need to review the current state of research and engage with key concepts.

If you want to take your discourse analysis a step further, you can also develop a theoretical framework. In that case, you’ll need to adjust your research question to incorporate the theory into your analysis.

Example:
How does political discourse on climate change influence public attitudes in fossil fuel-dependent regions of the United States?

In this context, the “spiral of silence” theory could be a useful framework. This theory explains why certain groups refrain from expressing their opinions when they believe they are in the minority.

#3 Data Sampling

Now it’s time to collect your data. For discourse analysis, this typically means documents, such as texts or publications, that best reflect the public discourse on your topic.

Example:
For the research question on climate change, relevant data could include campaign platforms from Democratic and Republican candidates, congressional speeches, opinion pieces from major newspapers like The New York Times or The Wall Street Journal, and environmental reports from think tanks.

The principle of theoretical sampling, which you might recognize from grounded theory, also applies here. Your sample can expand over time. For instance, you could start with a Democratic Party campaign platform and then add a contrasting perspective, such as a Republican Party campaign platform. Depending on your research question, you can iteratively build your dataset to better understand the discourse.

#4 Coding

When analyzing your data, Keller again draws on grounded theory. He suggests creating categories that summarize and link recurring aspects of the discourse. Write comments and memos, which you can then abstract into broader categories.

Example:
In the discourse on climate change, a category like “economic impacts” might emerge if discussions frequently center on how climate policies affect jobs or industry competitiveness in the United States.

The unique aspect of discourse analysis is that it doesn’t focus on individual statements or actors (as is often the case with expert interviews) but rather on how the entirety and polarity of statements and actors interact. Your goal is to uncover overarching patterns that define the discourse.

#5 Presenting Results

In your results section, explain what you’ve uncovered about the discourse in relation to your research question. It might make sense to structure your findings by actors or thematic patterns based on your categories. Use subheadings for clarity and tables to present your results concisely and accessibly.

Discourse Analysis 2

Discussing the Results of Your Discourse Analysis

These questions are a great way to guide your discussion. You can either work through them one by one to create a detailed overview of the discourse or pick a few key questions to focus on.

If you’re writing a term paper, it’s probably best to keep things manageable and stick to one or two questions. But for a master’s thesis, you’ll have more space to dig deeper, so tackling as many questions as possible will give you a richer, more comprehensive understanding of the discourse.

The main goal is to really analyze what’s happening in the discourse—its evolution, how it connects to other discourses, and the power dynamics driving it.

  • What triggers the emergence of a discourse, and what factors contribute to its decline or transformation?
  • What linguistic or symbolic strategies are employed to frame and convey meanings within the discourse?
  • In what ways does the discourse shape and define objects, concepts, or identities?
  • Which key events or turning points have significantly influenced the trajectory of the discourse?
  • Which actors occupy specific speaker positions, and what strategies do they use to assert or legitimize their authority?
  • Who initiates or controls the discourse, who is the intended target, and how is it received by the audience?
  • What relationships or tensions exist between this discourse and other intersecting or opposing discourses?
  • How does the discourse reflect, reinforce, or challenge prevailing social, cultural, or political contexts?
  • What power effects are produced by the discourse, and how do these effects influence or intersect with societal practices and structures?

If the scope of your work allows, try to incorporate as many of these questions as possible into your discussion.

Conclusion

With Foucault’s concept of discourse, Keller’s 5-step methodology, and the discussion questions, you’re well-equipped to conduct your own discourse analysis.

However, remember: this video is only a quick introduction to the topic. It’s meant to inspire you to dive deeper. Grab Keller’s book or search for a documentary on Michel Foucault to immerse yourself further.

Discourse analysis isn’t difficult to understand or execute. There’s no strict right or wrong—it all depends on how you approach it.

Categories
Uncategorized

Focus Group Discussion – Qualitative Research Method (Tutorial)

Are you thinking about using a focus group discussion as a qualitative research method?

If so, take 10 minutes to go through this guide.

We’ll cover everything you need to know: starting with an introduction to the method and when it’s most effective, before walking you through the process step-by-step. By the end, you’ll be fully prepared to run your first focus group discussion and analyze the results with confidence.

What Are Focus Groups in Qualitative Research?

Focus group discussions were first used in market research and later adopted in sociology. Today, they’re a recognized and versatile qualitative research method applied in a wide range of fields.

In a focus group discussion, you, as the researcher, bring together a small group of experts to discuss your research topic, with you acting as the moderator.

What makes this method unique is its ability to generate a rich variety of interpersonal interactions in a short amount of time. These interactions can uncover more detailed background information than one-on-one interviews typically provide (Krueger, 1994).

This method isn’t limited to a single group—you can organize multiple groups with different participants or reconvene the same group at various stages of your research.

Unlike observations, focus group discussions take place in a controlled setting that you design. The discussions are collaborative, encouraging the exchange of new ideas, opinions, and reactions. The aim isn’t to spark heated debates but rather to foster thoughtful and meaningful dialogue.

When Are Focus Groups Useful in Qualitative Research?

Focus group discussions are flexible and can be applied in a variety of scenarios:

1. Developing Theory on a New Topic or Phenomenon

Focus groups are especially useful when exploring a relatively new topic with an exploratory approach. This involves relying less on existing knowledge or theories and using the discussion to develop new ideas or theories.

Remember, in research we often separate data collection from data analysis. Focus groups are a classic data collection method for gathering your own insights.

2. Research on Group or Team Dynamics

For example, if you’re studying how a new software tool impacts team dynamics, you could organize a focus group where participants test the software together and share their real-time experiences, rather than interviewing each member individually.

3. Evaluation Scenarios

Focus groups are also great for evaluations—assessing how well something works and whether it achieves its intended purpose.

Artifact?! What does that mean?

An artifact could be anything: a robot prototype, a learning app, a dietary guide, or even a theoretical framework. You could also use focus groups to evaluate a definition or model you’ve developed.

In all these cases, focus groups can provide deep insights.

Conducting a Focus Group Discussion in 7 Steps

1. Selecting the Right Participants

The ideal size for a focus group is 6 to 8 participants. The group should be “small enough for everyone to share insights yet large enough to provide diversity of perceptions” (Krueger & Casey, 2000, p. 10).

Smaller groups rely more heavily on individual expertise since each participant needs to contribute more. However, smaller groups may lack diversity in perspectives, which you should address in your research discussion.

Select participants who bring relevant expertise. The goal isn’t random sampling but purposeful sampling to identify the best candidates for the discussion.

Together, participants should represent a broad spectrum of perspectives on your research topic.

2. Creating the Right Setting

The setting of a focus group can significantly influence the conversation. Traditional methodology books often emphasize physical arrangements like seating layouts.

Today, tools like Zoom have expanded the possibilities. While virtual discussions may lose some of the group dynamics found in face-to-face settings, they allow you to gather experts from anywhere, potentially enhancing the quality of your group.

Choose between a physical or virtual setting based on your research needs, and consider the pros and cons of each. Virtual discussions are now widely accepted and can be just as effective.

3. Preparing for Moderation

Like qualitative interviews, focus group discussions benefit from a clear guide. As the moderator, it’s your role to steer the conversation.

Hennink (2014) describes this process using a sandglass model:

  • Start broad: Introduce the topic, provide context, and thank participants. Ask for consent to record and answer any questions.
  • Narrow the focus: Conduct a brief round of introductions and ask participants about their prior experience with the topic.
  • Main discussion: Dive into the core of the discussion, asking prepared questions or assigning a collaborative task.
  • Wrap up: Conclude with reflective or follow-up questions to address anything that wasn’t discussed earlier.

#4 Providing Materials (Optional)

If you’re working with a team, now’s the time to brief them. Sometimes it makes sense to have two people running the discussion: one person moderates, while the other supports by taking notes. If you’re organizing multiple groups, you might need additional moderators. In that case, make sure they’re properly briefed and familiar with the discussion guide.

The second point is about providing materials. If your focus group involves an interactive task, you might need supplies like posters, markers, or sticky notes.

For virtual settings, you can use tools like an online whiteboard, Google Jamboard for example, to achieve the same effect.

#5 Conducting and Recording

On the day of the focus group discussion, it’s best to have two recording options ready, just in case one fails. I usually record audio on both my phone and laptop at the same time. If possible, consider recording video too, it can be a valuable addition.

Make sure you’re familiar with data protection rules for recordings and handle the data responsibly. Store or delete the recordings in compliance with ethical guidelines to avoid any issues with your university’s ethics committee.

It’s also a good idea to take notes during the discussion. These can provide valuable supplemental data for your analysis.

#6 Transcription

The primary data source for your analysis will be the transcript of the discussion. This means either typing out everything verbatim or using a transcription tool to save time.

Your dataset will include the transcript, your notes, and any creative outputs from the group, like posters or other materials.

#7 Data Analysis

Once you have your data, it’s time to move on to analysis. At this stage, we’re stepping beyond the focus group discussion itself and into the broader research framework. The method you use for analysis will depend on how the discussion fits into your overall study design.

Common approaches include grounded theory, thematic analysis, or a combination of coding techniques. This would be the perfect opportunity to explore an in-depth guide on the analysis method that best suits your research!

Categories
Uncategorized

Conducting a Qualitative Meta-Study (Simply Explained)

Do you want to analyze qualitative data for your academic work, but the idea of conducting new interviews or collecting documents feels overwhelming? A qualitative meta-study might be the perfect solution for you.

This method has been gaining traction lately. And just like literature reviews, it doesn’t require you to collect your own data…

You can simply use qualitative data from other studies to uncover new connections and develop theories. It doesn’t get much more practical than that, does it?

In this video, I’ll walk you through how to conduct a qualitative meta-study while adhering to academic standards.

1. What is a Qualitative Meta-Study?

A qualitative meta-study (QMS) is a method for combining data from multiple qualitative studies on a specific topic. While a single study often provides only one perspective, QMS allows you to integrate findings from numerous studies, offering a more comprehensive and nuanced understanding.

Meta-analyses are well-established in quantitative research, where they statistically combine numerical data from various studies to draw universal conclusions. In qualitative research, however, the focus is on narrative data, such as interviews and case studies. These are not merely aggregated but reanalyzed, often from a new theoretical perspective, to generate fresh insights.

Until recently, the process for conducting QMS lacked clarity. But in 2024, a groundbreaking paper by Habersang and Reihlen provided detailed guidelines for structuring and standardizing QMS, making the method more accessible and comparable. This paper has been met with widespread acclaim, with many researchers calling it an “instant classic.”

Let’s dive deeper into these guidelines!

qualitative meta-study

2. The Three Reflective Meta-Practices by Habersang and Reihlen

To ensure qualitative meta-studies yield meaningful insights, Habersang and Reihlen propose three key reflective practices. These practices help you derive deeper understanding from your studies. We’ll cover how to select studies in the next section, but first, here’s what you need to know:

1. Translation

Different studies often use varied terminology for similar concepts. For example, one study might discuss “emotional leadership,” while another refers to “transformational leadership.” Translation involves aligning these terms into a shared language so the studies can be compared effectively.

This process goes beyond mere word alignment—it’s about understanding the underlying meaning of each concept. Your goal is to preserve the essential insights of each study while creating connections between them.

2. Abstraction

Abstraction involves distilling the details of individual studies to identify broader patterns and overarching theories. It’s about lifting the analysis to a higher level, enabling you to see commonalities across studies.

When abstracting, it’s essential to consider the unique context of each study while developing theories that apply across multiple cases. Striking the right balance between detail and generalization is key.

Developing theories might sound intimidating, but it’s not unlike other methods such as grounded theory or theoretical literature reviews. Creating new theoretical insights is often easier than it seems.

3. Iterative Interrogation

Iterative interrogation means revisiting your data repeatedly throughout the analysis to question and refine your assumptions. This process involves continuously challenging your interpretations and adapting them based on new patterns or insights that emerge.

Here, your “data” consists of direct quotes and findings from the qualitative studies you’re analyzing. While you might begin with a specific idea, the iterative process ensures your conclusions evolve as you uncover new evidence.

This constant interplay between critical questioning and discovery helps ensure your research is both innovative and grounded in clear, reproducible results.

qualitative meta-study 2

3. Guidelines for Conducting Confirmatory QMS

Confirmatory QMS tests existing theories by comparing findings from multiple studies. The goal is to determine whether the collected data supports or challenges a particular theory. This approach is particularly useful when you want to validate a widely accepted theory or identify inconsistencies across studies.

Guidelines and Procedure:

  1. Develop a Theory-Driven, Focused Research Question
    Start with a precise research question grounded in an existing theory. This question will guide you in formulating specific hypotheses, which you’ll test using data from various studies. Example: “Does transformational leadership increase employee satisfaction in flat hierarchies?” This hypothesis could form the basis for your QMS.
  2. Justify a Comprehensive or Selective Search Strategy
    Decide whether to conduct a comprehensive search (aiming to include as many relevant studies as possible) or a selective search (focusing on high-quality studies that align closely with your research question). Example: If you’re studying the impact of transformational leadership in startups, you might specifically look for case studies from that context.
  3. Select Homogeneous and Comparable Cases
    Choose cases that are methodologically and theoretically aligned to ensure meaningful comparisons. However, including a few outliers can be useful for testing the boundaries of your theory. Example: If comparing leadership styles, ensure the methods for measuring employee satisfaction are consistent across studies. An outlier might be a study showing that transformational leadership only works in specific cultural contexts.
  4. Synthesize Through Aggregation
    Aggregation involves combining the findings of different studies to see whether they support or contradict your hypotheses. Use deductive categories (e.g., “Supports the theory?”) and introduce inductive categories when unexpected patterns arise. The goal is to create a clear theoretical model showing how well your hypotheses hold up.
  5. Ensure Quality Through Transparency
    Document every decision and step of your analysis process. Transparency is crucial for ensuring your work can be replicated and validated by others. Maintain a detailed log covering everything from your literature search to your case selection and analysis.

4. Guidelines for Conducting Exploratory QMS

Exploratory QMS focuses on developing new theories or expanding existing ones. The goal is to explore studies for fresh patterns or explanations that might have been overlooked. This method is especially helpful when there are no clear existing theories on the topic.

Guidelines and Procedure:

  1. Develop an Open Research Question
    Keep the research question broad to allow for new ideas and theories to emerge. Refine the question as patterns or insights from the data guide you. Example: You could investigate the phases of digital transformation across organizations without relying on a predefined theoretical framework.
  2. Broad or Targeted Literature Search
    Conduct a broad search to capture diverse data or focus on particularly rich studies that provide deep insights into specific aspects of your topic. Example: Collect case studies from various industries to understand how digital transformation unfolds in different settings.
  3. Choose Heterogeneous and Diverse Cases
    Include diverse and contrasting cases to uncover new perspectives and patterns that might not emerge in a homogeneous dataset.
  4. Synthesize Through Configuration
    Reinterpret the data creatively to develop a new theoretical model, rather than forcing it into predefined categories. Goal: Generate fresh insights about the phenomenon by integrating findings from different studies.
  5. Ensure Quality Through Diversity and Depth
    The success of exploratory QMS depends on the variety and depth of the analyzed cases. The better you identify and articulate new patterns, the stronger your theoretical contribution.

Summary of QMS Types

Here’s a quick comparison of the two types of QMS:

CriterionConfirmatory QMSExploratory QMS
GoalTest and refine existing theoriesDevelop new theories
Research QuestionFocused, theory-drivenOpen, broadly defined
HypothesesPredefinedNone—focused on discoveries
Search StrategyComprehensive or selectiveBroad, but targeted cases also possible
SampleHomogeneous and comparableHeterogeneous and diverse
SynthesisAggregation of findingsConfiguration of new theoretical models
Quality CriteriaTesting and refining theoriesDeveloping new theories

A qualitative meta-study is certainly not the easiest method to tackle, but it’s a perfectly feasible choice for something like a master’s thesis. If you already have experience with qualitative research or are willing to invest the time to learn this method, suggesting a QMS can really impress your supervisors.

Good luck with your research!

📖 Habersang, S., & Reihlen, M. (2024). Advancing qualitative meta-studies (QMS): Current practices and reflective guidelines for synthesizing qualitative research. Organizational Research Methods.

Categories
Uncategorized

Theoretical Literature Review According to Webster & Watson (Tutorial)

Are you struggling with writing an independent theoretical literature review, perhaps even as part of your thesis and don’t know where to begin? Don’t worry! With the guidance from Webster and Watson (2002), you can bring structure to the chaos and impress even the harshest professor.

In this article, I’ll show you how to write a literature review based on Webster & Watson’s recommendations in 7 easy steps.

By the end of this tutorial, you’ll realize it’s not as daunting as it seems. In fact, it’s simpler than you think!

Writing a Literature Review According to Webster and Watson (2002)

Webster & Watson (2002) were the first to introduce a structured process for writing what’s now known as a “theoretical” literature review.

It’s important to note that systematic reviews originated in medicine, where their main purpose is to summarize empirical research findings.

In other disciplines, like most social sciences, the literature base is much more diverse. You’ll encounter qualitative studies, quantitative studies, mixed-methods research, and even purely conceptual papers.

The original methodology of systematic literature reviews or meta-analyses (as applied in medicine) doesn’t work well here. These methods rely on a highly uniform body of research, where nearly every study reports similar statistical tests.

That’s why the social sciences have developed what’s now referred to as a “theoretical literature review.” Some studies still use the term “systematic literature review,” even though they aren’t summarizing purely quantitative findings as originally intended.

A theoretical literature review brings together all types of literature and aims to contribute a unique theoretical perspective that goes beyond the sum of the individual studies.

This is why Webster & Watson’s (2002) article is titled “Analyzing the Past to Prepare for the Future.”

Here’s how they envision a theoretical literature review:

Theoretical Literature Review 1

1. Your Literature Review Must Be Concept-Centric

At the beginning of your review, just like any academic paper, you need to identify a research gap or highlight a problem in the existing literature. The key here is to focus on a theoretical problem.

For instance, let’s say your topic is digital transformation in the workplace. That’s the phenomenon but it’s not a theoretical concept. A theoretical concept in this context might be “identity.”

The problem shouldn’t be practically motivated (e.g., companies struggling to adopt technologies like Zoom in the workplace) but theoretically motivated. For example, what Identity Theory A claims might contradict what we observe in reality, suggesting that Theory B might provide a better explanation.

In this example, current literature might focus either on organizational identity (Who are we as a company?) or individual identity (Who am I as an employee?). However, in the context of digital transformation, these identities are deeply intertwined. We need theoretical explanations to understand this interplay and its connection to technology.

Next, your background chapters should precisely define key concepts and clearly outline the scope of your literature analysis. In our example, you might need one chapter on digital transformation in the workplace and another on identity theory.

Webster & Watson also stress the difference between concept-centric and author-centric literature analysis—a distinction that’s relevant to all academic writing, so take note!

  • Concept-centric writing begins like this:
    Concept X (e.g., identity) … (Author A; Author B)
  • Author-centric writing begins like this:
    Author A states that Concept X (e.g., identity) …

A theoretical literature review is always concept-centric – not just in writing style but also in its structure. You need a central theoretical concept – without it, you’re not writing a theoretical literature review according to Webster & Watson (2002).

Theoretical Literature Review 2

2. Finding the Right Literature

To conduct a thorough literature review, the first step is to find relevant studies and papers on your topic. Webster and Watson recommend starting with the most prominent journals in your field. If your topic spans multiple disciplines, you may need to look into related fields as well. For example, research on digital transformation and identity in the workplace could appear in management, human resources, information systems, computer science, and psychology journals.

It’s crucial, however, to clearly define the scope of your review. Avoid making it too broad—this can quickly become overwhelming and dilute the impact of your theoretical contribution. Instead, focus on a specific angle or perspective that allows you to make a precise and meaningful contribution to the field.

This is where Webster and Watson adapt a key element from traditional systematic literature reviews: the structured search process. Use well-defined search terms and systematically explore academic databases. Additionally, they suggest incorporating a systematic search technique to expand your review.

3. Backward and Forward Searches

Once you’ve identified some initial studies through your database search, you can expand your review using two complementary techniques: backward and forward searches.

  • Backward Search: Examine the reference lists of the studies you’ve already found. This helps you uncover older, foundational works that might be relevant to your research. It also gives you insight into how the field has evolved over time.
  • Forward Search: Use citation databases like Google Scholar to identify newer studies that have cited your initial sources. This allows you to explore the most recent research developments in your area of interest.

Example:

Let’s say you’ve found a 2022 study by Author X on remote work and identity. A backward search might lead you to earlier works by Author Y (2016) and Author Z (2020) that explore similar themes. A forward search, on the other hand, could help you discover a 2023 study by Author A that offers valuable insights into your topic.

By combining these approaches, you’ll build a comprehensive foundation for your review, covering both historical context and current developments in your field.

4. Creating a Concept Matrix

Webster and Watson strongly advise against organizing your literature by author or publication date. Instead, they recommend grouping studies by concepts. This approach helps you identify patterns across the literature and makes it easier to compare findings.

The tool they suggest for this is a concept matrix—a simple table that allows you to categorize studies based on the theoretical concepts they address. This method not only makes your analysis more systematic but also helps you identify gaps in the research.

Example Concept Matrix:

StudyIndividual IdentityOrganizational IdentityInter-Organizational Identity
Author A (2015)X
Author B (2017)X
Author C (2020)XX

Using a concept matrix like this, you can visually map the relationships between studies, identify areas that are well-researched, and pinpoint gaps that need further exploration. This clarity not only helps you structure your review but also provides a strong foundation for your theoretical contribution.

Additionally, you can include the matrix as a figure in your final paper to make your analysis more transparent and visually appealing.

theoretical literature review 3

5. Theory Development

A key part of Webster and Watson’s method is developing a theoretical contribution.

A theoretical literature review isn’t just about summarizing existing studies it’s also about proposing new theoretical ideas. This might involve creating a theoretical framework or model based on your analysis.

There are several ways to approach this, and while none of them are simple, once you understand what’s expected, your review can make a meaningful contribution.

Option 1: Develop a Theoretical Model/Framework from Scratch

With this approach, you analyze the selected literature without relying on an existing theory. For instance, you could develop a model for identity threats caused by workplace technologies, perhaps focusing on employees at the individual level.

Option 2: Build on an Existing Theoretical Model/Framework

Here, you take an established framework or model from another context and expand it. For example, there might already be a model in psychology that explains identity threats without considering technology. Your literature analysis could extend this model by incorporating a technological dimension.

6. Formulating Propositions

Webster & Watson emphasize that your review should make it easy for other researchers to build on your work and apply your ideas.

One way to do this is by formulating propositions – generalized ideas that others can test quantitatively as hypotheses or explore further using qualitative methods.

Example: Digital Transformation and Identity

Let’s say your analysis uncovers a range of findings on identity threats:

  • Author A (2015): Strategic investments in artificial intelligence threaten the identity of customer service employees.
  • Author B (2017): ChatGPT reinforces the identity of individuals in management roles.
  • Author C (2020): Increased use of Zoom weakens organizational identity.

These findings hint at broader theoretical relationships that you can summarize as propositions. In reality, you’d usually be working with far more studies than just three.

Possible Propositions:

  1. Strategic investments in artificial intelligence undermine the professional identity of employees in roles that traditionally rely on personal interactions.
  2. The use of AI technologies strengthens the professional identity of managers by supporting their decision-making and leadership roles.
  3. Increased remote work reduces employees’ sense of belonging and identification with their organization.

In your review, it’s best to focus even more narrowly than in this example. For instance, concentrating only on individuals or only on organizations.

7. Evaluating Your Model/Framework and Propositions

To support your theoretical ideas, Webster & Watson recommend drawing on three main sources:

  1. Theoretical Explanations
    Base your theoretical ideas on established scientific models and concepts. These theories help explain the “why” behind your propositions by highlighting known relationships and mechanisms. They provide a logical foundation that gives your propositions credibility.
  2. Empirical Findings
    Use evidence from related studies or similar research topics to back up your propositions. These findings show that similar relationships have already been successfully tested, even if they don’t directly address your specific topic.
  3. Practical Experiences
    Practical insights or real-world case studies can also support your propositions. These examples demonstrate how your concepts or models work in practice, complementing the theoretical and empirical foundations.

Wrap up your discussion by outlining the implications for researchers and, if relevant, for practitioners.

Now all that’s left is to write a conclusion, and your theoretical literature review is complete!

Have questions? Drop me a comment!

Categories
Uncategorized

Always Tired? Try These 7 Fixes That Work (Scientifically Proven)!

always tired

Do you often feel tired, sluggish, and drained?

Don’t worry – you’re not alone!

In this article, I’ll explain why you constantly feel exhausted and share seven scientifically backed strategies to turn things around.

Stay awake till the end, because there’s a lot to learn and by the time we’re done, you’ll know exactly what to do to feel energized again.

The Basics of Fatigue

Before diving into the causes and solutions, let’s first understand what fatigue actually is.

Fatigue is a complex phenomenon with both physical and mental causes. When you’re tired, your body is signaling that it needs rest or sleep to recover and recharge.

A key factor to understand here is the human sleep cycle. Our sleep consists of different phases that repeat in roughly 90-minute cycles:

  • Light Sleep: This is when you’re drifting off and can be easily woken.
  • Deep Sleep: Crucial for physical recovery and growth.
  • REM Sleep (Rapid Eye Movement): The phase where most dreaming happens, essential for mental recovery and memory.

The importance of these cycles lies in the fact that your body and mind recover in different ways during each phase. Waking up in the middle of a cycle can leave you feeling groggy, even if you’ve clocked enough hours.

Always tired? Understanding and respecting these cycles can help you sleep better and wake up refreshed.

Causes of Fatigue and How to Fix Them

#1 Insufficient Sleep

Too little or poor-quality sleep can leave you perpetually tired. Let’s face it—you can’t expect to bounce through the day like a ball of energy if you spend half the night scrolling TikTok, dancing, or downing tequila.

Solution: Stick to a regular sleep schedule

A consistent sleep routine helps stabilize your body’s internal clock. Try to go to bed and wake up at the same times every day—even on weekends. Yes, that means no sleeping in till noon on Sundays.

Your body loves routine, as boring as that sounds. Create a relaxing evening ritual to prepare for sleep. A warm bath, a good book, or soft music can work wonders. And ditch screens for at least an hour before bed—blue light from phones and laptops can seriously mess with your sleep.

From a scientific perspective, our body’s circadian rhythm (our internal clock) thrives on regularity. Research shows that maintaining a steady sleep schedule improves sleep quality and reduces the risk of sleep disorders.

always tired1

#2 Poor Sleep Environment

Feeling always tired might be due to an unsuitable sleep environment. Too much light, noise, or an uncomfortable temperature can prevent you from getting a good night’s sleep.

Solution: Optimize your sleep environment

Ensure your bedroom is dark, quiet, and cool. Invest in blackout curtains or an eye mask, and consider earplugs if your roommate snores like a chainsaw.

Keep the room temperature comfortable—around 18°C (64°F) is ideal for most people. And if your mattress feels older than you are, it might be time for an upgrade.

Research shows that a cool, dark, and quiet environment boosts melatonin production, the hormone that regulates sleep, leading to better rest.

Personally, I struggle most in winter. When it’s still pitch-black at 7:30 a.m., all I want to do is stay in bed. Sunrise alarm clocks, which gradually brighten to mimic the rising sun, have been a game-changer for me during dark winters.

always tired2

#3 Stress and Emotional Overload

Stress raises certain hormone levels that can interfere with sleep. If your mind is racing with endless worries, falling asleep can feel impossible.

Solution: Manage your stress

Stress-reducing techniques can help lower your stress levels. Try relaxation methods like meditation or breathing exercises. Even five minutes of deep breathing can work wonders. There are plenty of great apps to guide you—Waking Up, 7Mind, Calm, or Mindbuilding, to name a few.

Keeping a journal can also help. Write down everything that’s bothering you—it’s often a relief to get your worries out of your head and onto paper.

Scientifically speaking, studies show that mindfulness exercises and meditation can lower cortisol levels, the hormone associated with stress. Journaling has also been shown to effectively reduce stress, improving sleep quality.

#4 Unbalanced Diet

Poor eating habits can negatively impact your sleep. Heavy meals late at night not only give you weird dreams but also disrupt your sleep.

Solution: Adjust your diet

Avoid greasy foods and caffeine before bed. That midnight burger? Bad idea. Your body needs time to digest food, and a full stomach can make it harder to sleep. Aim to have your last meal at least two to three hours before bedtime.

Caffeine stays in your system for up to six hours, so make your last cup of coffee no later than 3 p.m.—earlier if possible.

Caffeine blocks adenosine, the chemical that makes you feel sleepy, which is why overconsumption can ruin your sleep.

#5 Lack of Exercise

Regular physical activity supports healthy sleep. If you’re a couch potato all day, your body might not be tired enough to sleep well.

Solution: Move regularly

The best sleep-boosting exercises include cardio (like running, swimming, or cycling), yoga, and moderate strength training.

The ideal time for exercise is in the morning or early evening. Avoid intense workouts close to bedtime—your body needs time to wind down. Aim to finish your workout at least two hours before going to bed.

Exercise improves sleep quality by reducing the time it takes to fall asleep and increasing deep sleep duration. It also helps regulate your circadian rhythm and lower stress levels.

#6 Chronotype and Individual Sleep Needs

Your chronotype determines your internal clock, influencing when you feel most awake and productive. Always tired? This could mean your schedule is out of sync with your natural rhythm. Some people are early birds, buzzing with energy at 6 a.m., while others are night owls, hitting their stride at midnight.

Solution: Find the right balance

Your chronotype is largely genetic. Early birds thrive in the morning, while night owls are more active at night.

Adjust your schedule to suit your chronotype as much as possible. Night owls can schedule important tasks for the evening, while early birds can tackle their most challenging work in the morning.

Research shows that aligning your daily routine with your chronotype can improve performance and overall well-being.

always tired3

#7 Too Much Pressure

Many people stress about needing exactly eight hours of sleep every night. The truth? Ideal sleep duration is highly individual.

Solution: Listen to your body

The “eight-hour rule” isn’t one-size-fits-all. Some people thrive on less sleep, while others need more. Pay attention to your body to figure out what works best for you.

Chronic sleep deprivation—less than six hours a night—can cause serious health problems, so aim for at least seven to nine hours as a general guideline. But don’t stress over occasional bad nights—that pressure can make it harder to sleep.

Bonus Tip: Wearables

If you’re unsure how to track your sleep habits, consider using technology. Wearables like the Oura Ring, Fitbit, or Apple Watch come with tools to monitor your sleep and help you understand how your body responds to different stimuli.

But beware of the over-optimization trap. Life’s best moments don’t always lead to a perfect sleep score.

Literature:

3Brand, S., Holsboer-Trachsler, E., Naranjo, J. R., & Schmidt, S. (2012). Influence of mindfulness practice on cortisol and sleep in long-term and short-term meditators. Neuropsychobiology65(3), 109-118.

2Caddick, Z. A., Gregory, K., Arsintescu, L., & Flynn-Evans, E. E. (2018). A review of the environmental parameters necessary for an optimal sleep environment. Building and environment, 132, 11-20.

6Montaruli, A., Castelli, L., Mulè, A., Scurati, R., Esposito, F., Galasso, L., & Roveda, E. (2021). Biological rhythm and chronotype: new perspectives in health. Biomolecules, 11(4), 487.

1Ohayon, M. M., Lemoine, P., Arnaud-Briant, V., & Dreyfus, M. (2002). Prevalence and consequences of sleep disorders in a shift worker population. Journal of psychosomatic research, 53(1), 577-583.

4Reichert, C. F., Deboer, T., & Landolt, H. P. (2022). Adenosine, caffeine, and sleep–wake regulation: state of the science and perspectives. Journal of sleep research31(4), e13597.

5Yang, P. Y., Ho, K. H., Chen, H. C., & Chien, M. Y. (2012). Exercise training improves sleep quality in middle-aged and older adults with sleep problems: a systematic review. Journal of physiotherapy58(3), 157-163.

Categories
Uncategorized

How Many Interviews Do I Need for My Thesis?

You’re in the early stages of your thesis and have decided to conduct interviews to gather empirical data. But now comes the big question: how many interviews do you actually need? Five? Ten? Fifty?

This is one of the most common questions I get asked, and the answer is—it depends.

Don’t worry, though. In this article, I’ll walk you through how to determine the optimal number of interviews for your study.

Why Isn’t There a Single Correct Answer?

You might have heard the phrase, “There are no fixed rules in qualitative research.” But what does that really mean? Unlike quantitative research, where sample size is often determined using statistical calculations, qualitative research is more flexible. Each qualitative study has different goals and uses different methods. This variability means there’s no universal number of interviews that’s always right—just guidelines and recommendations.

Luckily, Wutich and colleagues (2024) tackled this exact question in their paper. They developed a step-by-step flowchart to help you figure out the right number of interviews for your study.

According to the authors, the number of interviews largely depends on your research goals and methods. So, the first step is to clearly define what you want to achieve with your study and what kind of insights you aim to uncover. The appropriate number of interviews will then be guided by your research goals and how deeply you want to dive into the topic.

Their paper introduces several recommendations to help you narrow down the number of interviews without fixating on a rigid number. One central concept is saturation—the point at which additional interviews no longer provide new information.

How Many Interviews Do I Need for My Thesis?

The Five Key Approaches to Determining the Number of Interviews

The flowchart begins with a fundamental question: What is your research goal? Depending on whether you aim for a broad overview or an in-depth analysis, you’ll need a different amount of data.

1. Theme (Data) Saturation

If your goal is to gain a general overview of the main themes in your research area, you should aim for theme saturation. This occurs when no new themes emerge, and you’ve identified all the key aspects of your research topic. Wutich et al. (2024) recommend about nine interviews or four focus groups for this type of saturation. Theme saturation is ideal for studies designed to provide an overview of central themes, such as identifying the main stress factors among students.

Example: Imagine you’re exploring the topic of “stress in university life” and asking students what they find stressful. If, after several interviews, responses like “exam pressure” and “time constraints” keep repeating without any new factors emerging, you’ve reached theme saturation.

2. Meaning Saturation

For studies aiming to capture not just themes but also the interpretations and meanings of these themes from the participants’ perspectives, meaning saturation is the focus. This type of saturation digs deeper into the details associated with a theme. According to Wutich et al. (2024), meaning saturation usually requires about 24 interviews or eight focus groups.

Example: You’re studying how students experience exam stress. Instead of just identifying stress factors, you aim to understand how they perceive this stress. For some, it might stem from perfectionism, while for others, it’s due to time pressure or lack of support. When you’ve captured all these perspectives and no new interpretations arise, you’ve reached meaning saturation.

3. Theoretical Saturation

This approach is common in Grounded Theory, where the goal is to develop a theory that provides new insights into a phenomenon. Theoretical saturation involves understanding patterns and connections between different themes and building a theoretical foundation. According to Wutich et al. (2024), achieving theoretical saturation typically requires 20–30 interviews or more, depending on the complexity of the theory being developed.

Example: Suppose you’re developing a process theory on stress management in university life, exploring how various strategies interact over time. To create a comprehensive theory, you need detailed data covering multiple perspectives and connections. Theoretical saturation is achieved when additional interviews no longer refine or improve your theory.

Once you reach this point, you can stop collecting data—whether it’s at 23, 35, or 42 interviews. What matters is the outcome, not the exact number of interviews.

4. Metatheme Saturation

The meta-theme analysis method was originally developed to study cultural differences in language. Over time, it evolved into a mixed-methods approach that identifies overarching themes from qualitative data. This method combines qualitative data with quantitative analyses of word meanings or codes.

In recent research, meta-theme analysis has shifted towards qualitative applications, focusing on identifying and comparing shared themes across datasets collected in different locations or cultures. Typically, 20–40 interviews per site are needed to develop a solid list of main themes and identify common variations within each site.

Example: You’re researching “stress in university life” and interviewing students in both Germany and the USA. To highlight differences and similarities between these countries, you conduct enough interviews for each group until the central themes in each group start to repeat.

5. Saturation in Salience

With saturation in salience the focus is on identifying the topics that are most important to participants. This type of saturation often uses a method called “free listing,” where participants list the topics or challenges that matter most to them. Salience saturation is reached when the participants’ lists begin to repeat. Wutich et al. (2024) suggest that 10 detailed free lists are often enough.

Example: If you ask students to list the biggest challenges in university life, and after about 10 lists, no new topics emerge, you’ve reached saturation in salience. This method is especially useful for quickly identifying the central issues that are most relevant to your participants.

How Many Interviews Do I Need for My Thesis?1

Applying the Flowchart Step by Step

Now that you’re familiar with the five types of saturation, here’s a quick guide to using the flowchart to determine the number of interviews for your study:

  1. Define Your Research Goal
    Decide whether you want an overview of a topic or deeper insights and connections, such as developing your own theory or model.
  2. Choose the Right Type of Saturation
    Select the type of saturation that aligns with your goal—for example, theme saturation for a broad overview or theoretical saturation for theory development.
  3. Set an Initial Number of Interviews
    Start with the recommendations from Wutich et al., such as nine interviews for theme saturation or 20–30 for theoretical saturation.
  4. Analyze and Adjust
    Analyze your data and check whether saturation has been reached. If new themes or meanings emerge, conduct additional interviews as needed.
  5. Draw Conclusions
    Once saturation is reached and no new insights are uncovered, you’ve identified the right number of interviews for your study.

Practical Tips for Deciding on the Number of Interviews

While the flowchart provides a solid framework, practical factors also come into play. For example, the limited time available to complete your thesis. Here are some tips for efficiently implementing the recommendations:

  • Stay Flexible: Qualitative research is dynamic. You may need to adjust the number of interviews during data collection—whether because new themes emerge or many themes begin to repeat. Start with an approximate number and adapt as needed.
  • Use Pilot Interviews: Pilot interviews are a great way to get an initial impression and test your questions. They also help you estimate how many interviews you’ll need to cover all the relevant themes.
  • Plan Time and Resources: Conducting and analyzing interviews is time-consuming. Consider how many interviews you can realistically handle without compromising the quality of your work.
  • Focus on Data Quality: A thorough analysis of fewer interviews can often be more valuable than a superficial analysis of many.

Source: Wutich, A., Beresford, M., & Bernard, H. R. (2024). Sample Sizes for 10 Types of Qualitative Data Analysis: An Integrative Review, Empirical Guidance, and Next Steps. International Journal of Qualitative Methods, 23, 1-14.