Have you ever wondered what the distinction between dependent and independent variables is?
Then you’ve stumbled upon digital gold.
In this article, I will explain to you shortly but precisely what the difference between dependent and independent variables is and what function they play in your quantitative research design.
If you’re still interested after that, I will go a bit more in-depth and explain why this designation of variables in the context of survey studies and other methods is often not correct and how to correctly describe them.
Why do you need dependent and independent variables in a quantitative research design?
In a quantitative research design, your goal is to test a theoretical relationship. One of the building blocks of theory constructs that consist of variables.
In order to test a hypothesis in a quantitative research design, you must first determine the variables of that hypothesis and ensure that you can measure them.
As the name suggests, variables can change. They can experience various forms of change, for example, changing human behavior such as the tendency to choose more organic fruit at the supermarket.
Similarly, a variable can vary by location, such as in counties with the highest subsidies on organic fruit. Moreover, a variable can change over time, such as a fruit vendor’s profit per quarter.
Independent variables are the variables that are manipulated or changed in order to observe the effect on the dependent variable. In our example, the independent variable would be the type of fruit (organic vs. non-organic) and the dependent variable would be the number of fruits sold.
Variables in hypotheses
A hypothesis typically includes two variables and their relationship to each other. It’s about how one variable affects the other, i.e. the hypothesis expresses a relationship between cause and effect.
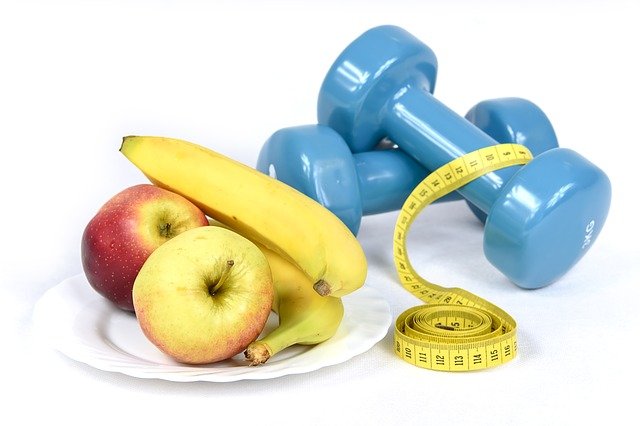
H: Eating a banana immediately after exercise increases muscle regeneration.
In this hypothesis, eating a banana is the cause. This is the independent variable.
Increased muscle regeneration is the expected effect. This is the dependent variable.

Independent Variables
Ok, and why is the first variable now independent?
That’s because this variable can be varied arbitrarily. The variable could also be “drinking a protein shake”. Or: eating two bananas.
In that sense, this variable does not depend on other variables – hence independent variable.
Dependent Variables
The second variable, which represents the effect, is called dependent because the value of this variable depends on the cause.
In reality, however, independent and dependent variables are often not as clear-cut as they may seem. In many real-world situations, multiple variables can be both independent and dependent at the same time, depending on the specific research question and the level of analysis.
For example, in a study looking at the relationship between income and education, income could be considered the independent variable at the individual level, but when looking at the relationship at the societal level, education could be considered the independent variable.
Additionally, it’s important to note that the cause-and-effect relationship between independent and dependent variables can be difficult to establish as it may be influenced by other factors. That is why we need experiments.
Dependent and independent variables in experimental designs
These terms originated in the context of scientific experiments. To test the example hypothesis, you could set up an experimental design that examines a sample of athletes. Under supervision, each participant receives a banana – this is how the independent variable is measured.
Then they can let off steam during the workout and afterwards their muscle regeneration, the dependent variable, is measured.
In this experiment, the independent variable can now be varied, this is also referred to as “manipulation”.
3 example experiments
Example #1
For an experiment, the temperature inside a car is changed. People sitting in the car indicate how they feel at each temperature. Temperature is the independent variable. The dependent variable is the reported well-being of the occupants.
Example #2
You want to investigate how smartphone usage affects heart rate. The independent variable is smartphone usage and the dependent variable is heart rate.
Example #3
You want to find out how time spent working from home affects the work performance of your employees. In this example, the independent variable is time spent working from home and the dependent variable is work performance.

Dependent and independent variables in cross-sectional studies
In an experiment, data is collected at different times. This allows the study director to manipulate the independent variable.
In studies that only collect data from different individuals at a single point in time, this is not the case. This is also referred to as cross-sectional studies. An example of this is an online survey.
Here, variables cannot be manipulated and thus no causal relationships can be tested. The terminology of independent and dependent variables would therefore be incorrect. Nevertheless, everyone knows what is meant when you talk about it, but if you want to be completely correct, you can use
Predictor variable or prognostic variable instead of independent variable and
Response variable instead of dependent variable in speaking or writing.
After all, predictions about variables are also made in cross-sectional studies – only causality is not assumed.
If you’re interested, the difference between causality and correlation has been discussed in another video that you can find linked on the top right.
For experiments, this designation also works. You could therefore theoretically always use the designation predictor variable and response variable – independent and dependent only in the context of experiments (Field, 2015).
Measuring
Of course, the method is of the utmost importance here. For a quantitative study design, as already mentioned, experiments or standardized surveys such as online surveys can be used. But also collecting sensor data or other measurements or collecting documents, texts or social media data can be the basis for a quantitative research design.
Each method now produces data that has different levels of measurement or scale levels. These scale levels, if you will, decide the quality of your variables and what statistical operations are available to you to test your hypothesis.

Reliability and Validity of measuring variables
It is important to note that in order to make accurate inferences and conclusions, variables must be measured in a reliable and valid manner. Reliability refers to the consistency of measurement, while validity refers to the accuracy of measurement. For example, if you are measuring the number of organic fruits sold in a supermarket, it is important that the counting method is consistent and accurate.
If your variables are metric scaled, i.e. they consist of numerical values (e.g. number of bananas eaten), then the relationship (depending on the data, causal or correlational) between the dependent and independent variable can be calculated using a regression analysis.
Variables for regression analysis
Exactly how to do this is a topic for another video – but at least you now have a small glimpse of what you can do after determining and measuring your variables.
I hope this was helpful and if you want to delve further into this topic, I recommend the textbooks by Andy Field.
