Categories
Research Methods

PRISMA Literature Review (Flow Chart & Example)

Are you planning to conduct a systematic literature review and want to follow the PRISMA protocol for this?

It’s easier than you think!

In this article, I’ll explain what PRISMA is and show you exactly how you can apply it in your own literature review.

What is a PRISMA Literature Review?

PRISMA stands for “Preferred Reporting Items for Systematic Reviews and Meta-Analyses.” It’s a guideline developed to improve the process and reporting of systematic reviews and meta-analyses.

These literature-based papers are particularly valuable because they summarize the findings of many individual studies, providing a more comprehensive picture of a topic.

The PRISMA guidelines offer a standardized framework that ensures all important aspects of a systematic review are reported transparently and completely. This includes describing the search strategy, the criteria for selecting studies, the method for data extraction, and the assessment of study quality.

One important point is that PRISMA does not provide specific instructions on how to conduct the systematic review itself.

It does not include detailed steps for what databases to select or, how to analyze the data. These tasks fall under the methodology of the systematic review and are a bit dependent on your field. Therefore, you need to come up with your own analysis method and combine it with PRISMA.

However, PRISMA helps guide you through the systematic search process step by step and documents it thoroughly.

The Goals of PRISMA

The main goals of PRISMA are:

  • Transparency: Ensuring that your search strategy is clearly and thoroughly described so that other researchers can replicate and verify your study.
  • Completeness: All relevant information must be reported to give readers a full picture of your literature search.
  • Comparability: By standardizing the reporting, it becomes easier to compare and evaluate different systematic reviews.

You can find a complete overview here: https://www.prisma-statement.org/prisma-2020.

When following the PRISMA guidelines, always make sure to cite the original source that contains the most recent version of the guidelines. The current version is PRISMA 2020. Here’s the complete reference for the PRISMA 2020 guidelines:

Page, M. J., McKenzie, J. E., Bossuyt, P. M., Boutron, I., Hoffmann, T. C., Mulrow, C. D., … & Moher, D. (2021). The PRISMA 2020 statement: an updated guideline for reporting systematic reviews. BMJ 2021, 372.

What is the PRISMA Flow Chart?

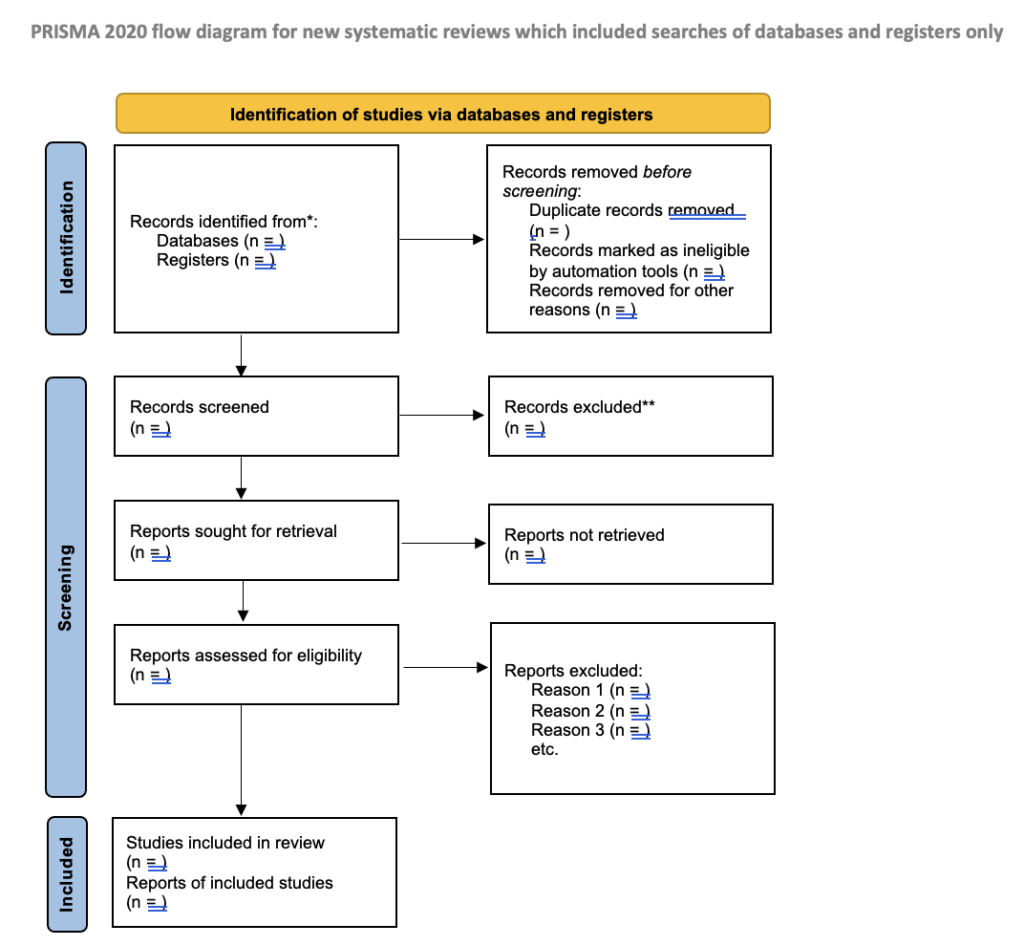
The PRISMA flow chart, also sometimes called the PRISMA diagram, is a chart that shows how studies are selected for a systematic review.

It consists of four main phases:

  1. Identification: You search databases and other sources for studies and record the total number of studies found.
  2. Screening: You review the titles and abstracts of the studies and filter out those that are not relevant.
  3. Eligibility: You read the full text of the remaining studies and exclude those that do not fit your criteria.
  4. Inclusion: The final group of studies that will be included in your literature review or meta-analysis remains.

The PRISMA diagram helps you document the selection process clearly and ensures that nothing important is overlooked.

In the methods section of your paper, you should mention that your systematic review followed the PRISMA guidelines.

By explicitly mentioning PRISMA in the methodology section, you ensure that readers (and your supervisor) recognize and (hopefully) appreciate the structured approach of your systematic review.

Implementing a PRISMA Literature Search

Here are a few simple steps to implement the PRISMA literature search in your own work:

  • Research: Search multiple databases, such as PubMed or Scopus, for relevant studies. Make a note of how and where you searched.
  • Study Selection: Review the studies and remove those that don’t fit your criteria. Use the PRISMA diagram to document this process. You’ll need to develop your own selection criteria.
  • Data Extraction: Gather key information from the selected studies, such as sample size, methods, and results. What exactly you extract depends on what you’re investigating.
  • Study Quality Assessment: Assess the quality of the studies to ensure they are reliable.

Example of a Literature Review Using a PRISMA Diagram

To show you how PRISMA works in practice, let’s take a look at a paper that followed the PRISMA guidelines. The systematic review by Helen Crompton and Diane Burke, “Artificial intelligence in higher education: the state of the field,” examines the use of artificial intelligence (AI) in higher education.

PRISMA Literature Review

The PRISMA guidelines were used in this study to make the process of the systematic review transparent and complete. Here’s a simple explanation of how the PRISMA guidelines were applied:

  • Identification: The researchers conducted a literature search across several databases, identifying 341 relevant studies. Additionally, they conducted a manual search, finding 34 more studies. A manual search means that the researchers independently searched specific journals, reference lists, search engines, and websites in addition to the automated database search to ensure that no relevant studies were overlooked. Four duplicate studies were removed.
  • Screening: After removing duplicates, 371 articles remained. After reviewing the titles and abstracts, no articles were excluded, so all 371 proceeded to full-text screening.
  • Eligibility: The remaining articles were read in full and assessed. Some studies were excluded for the following reasons:
  • No original research (n = 68): These articles were not original studies, but rather reviews or commentaries.
  • Not in the field of higher education (n = 55): Studies were not related to higher education.
  • No artificial intelligence (n = 92): These studies did not deal with AI.
  • No use of AI for educational purposes (n = 18): AI was not used for educational purposes in these studies.
  • Inclusion: Finally, 138 articles were included in the systematic review. These articles were analyzed in detail and qualitatively coded to answer the study’s research questions.

Source: Crompton, H., & Burke, D. (2023). Artificial intelligence in higher education: the state of the field. International Journal of Educational Technology in Higher Education, 20(1), 22.

You just need to fill out the PRISMA flowchart with the results of your literature search and screening, and you can include it in the methods section of your paper as a figure. Super easy, right?

The PRISMA Checklist

Additionally, PRISMA offers useful resources like a checklist, available on the PRISMA website. This checklist helps ensure that systematic reviews and meta-analyses are reported in a complete and transparent manner. It consists of 27 items, organized into different sections, and serves as a guide to structure your review.

This checklist is particularly relevant if you are preparing a full systematic review for your thesis or paper.

Checklist Summary:
  • Title and Abstract: Clearly state that it is a systematic review. Provide a concise overview of the study.
  • Introduction: Outline the background and reasons for the review. Clearly define the review’s objectives and research questions.
  • Methods: Specify the inclusion and exclusion criteria for the studies. Describe the information sources and search strategies. Explain the selection and data extraction processes. Outline methods for assessing risk of bias and measures of effect. Detail how data from different studies were combined and analyzed.
  • Results: Present the results of the search and selection process, ideally using a flow diagram. Summarize the characteristics and findings of the included studies. Evaluate the risk of bias and the certainty of the results.
  • Discussion: Interpret the findings in the context of other evidence. Address the limitations of the evidence and methods. Consider the implications for practice and future research.
  • Additional Information: Provide details on the registration and protocol of the review. List both financial and non-financial sources of support. Disclose any potential conflicts of interest among the authors. Indicate the availability of data and materials.

While other PRISMA resources may be useful for high-level publications or complex meta-analyses, for your studies, the most relevant parts are the flowchart and sections of the checklist.

If you have any questions, feel free to leave a comment!

Categories
Research Methods

Deductive-Inductive Combination in Thematic Analysis (Tutorial)

Do you want to apply a combination of deductive and inductive thematic analysis in your qualitative research?

Is that even possible, and what should you keep in mind?

In the next few minutes, I’ll show you how to combine deductive and inductive coding, what authors like Braun and Clark, who are the most cited authors on thematic analysis think about it, and how to use this knowledge to perfect your qualitative study.

Inductive and Deductive Category Formation for Qualitative Content Analysis

If you’re familiar with my videos on thematic analysis, you know that this method distinguishes between two types of code and theme formation for analysing qualitative data.

#1 Building Themes Inductively

Here, you derive abstract codes from your data, that is, for example your interview transcripts. As the saying goes, the themes “emerge from the material.” This approach is also often referred to as “bottom-up” coding.

#2 Applying Themes Deductively

In this type of thematic analysis, you create a list of pre-defined themes from a theory or other literature.

Then, you approach the data with these themes in mind and systematically allocate your data to each theme. You can also count how often each theme occurs in your data set.

But what about a deductive-inductive combination? Does this have any advantages.

The answer is: Yes!

Deductive-Inductive Combination for Thematic Analysis

Since thematic analysis was originally invented to be an inductive method, but it’s not always easy to form new codes and themes purely from the ground up, a deductive-inductive combination is often a good way to get the best of both worlds.

Background

Why is this approach useful?

First, pure induction is powerful but difficult. For most research questions, pure induction isn’t the ultimate solution. The problem of induction, which frustrated David Hume and Karl Popper, still persists. Inferring a general rule from a single case is highly problematic. But, even if you are OK with that, it is quite difficult for beginners to confidently develop themes “out of nothing.” At the same time, supervisors often encourage you to read about theories. Incorporating existing theory in inductive research is quite a challenge, and you need a lot of experience to do it correctly.

Second, doing only deductive coding also has significant disadvantages. The theoretical framework you choose to work with is practically predetermined. Deduction doesn’t allow for breaking out of this framework, which means surprising insights that might contradict prior knowledge are not considered. These surprising insights are what make many research projects interesting and can potentially provide greater value for existing theory and literature.

Thus, a combination of both logics can be considered for thematic analysis.

deductive inductive combination

A deductive-inductive thematic analysis

In deductive thematic analysis, you choose your themes based on prior theoretical knowledge to guide the research process. The data is then coded and allocated into this structure (e.g., the main themes). You start with the same thing in your deductive-inductive thematic analysis.

But then, you use surprising findings or data that do not fit these themes to form new, inductive subthemes. If you find a lot, you can even add a main theme to your list of themes.

This can create theoretical added value, contributing something new to the existing knowledge – all while you enjoy the comfort of the theoretical framework you used for the deductive part of the coding.

Example

To better understand how a deductive-inductive combination works in thematic analysis, let’s look at a brief example.

Theory

Assume your study involves Identity Theory. It broadly states that individuals adopt certain characteristics, values, and norms to view themselves as unique compared to others. According to Burke and Stets (1999), three theoretical dimensions are involved in the identity formation process: Investment, Self-esteem, and Rewards.

These three theoretical dimensions could serve as a structure for your thematic analysis. According to deductive logic, three main themes would emerge:

#1 Main Category: Investment in… X (X=your topic)

#2 Main Category: Self-esteem based on… X (X=your topic)

#3 Main Category: Rewards from… X (X=your topic)

You could now structure your material, such as interview passages, according to these three main themes using regular coding techniques.

Now, you could inductively add subthemes by grouping your codes.

Or, based on data that doesn’t fit any of the three main themes, add another main theme based on that “left-over” data.

Data

Imagine you have the following quote in your interview transcript:

“Earlier, I thought I would have to give up my job completely to be a mother. Now I’m more confident that I can do both if I want, or if I want to work part-time or flexibly and arrange childcare without it affecting my career.”

This quote initially falls under Self-esteem, as it deals with self-perception and confidence in overcoming obstacles.

For this quote, you could create the subtheme “self-evaluation of own competencies.” This new subtheme could be placed under the main theme “Self-esteem in … X (X=your topic).”

You might find more quotes that fit into this subtheme, or perhaps quotes that form a completely new main theme – though this is unlikely with a well-established and often-tested theory.

You work inductively through your data until your system of main and subthemes forms a complete picture.

What Braun and Clark Say About the Deductive-Inductive Combination?

The authors of the most cited paper on the method have made clear that the method was originally intended to follow an inductive logic. With their focus on being “reflexive” as a researcher underscores this.

However, it is exactly this what makes qualitative research so flexible. It is not about following a guide from start to finish and never deviate from it. It is about tailoring the analytical approach to your needs and what makes the most sense in your situation.

Therefore, Braun and Clark would agree that combining both logics can be of value if it makes sense in your context.

Outside the Braun and Clark bubble, many researchers see deductive-inductive code formation as a very legitimate way to conduct qualitative research, especially, if you are a beginner.

As I always emphasize, you have the freedom to tailor your approach to your needs, as long as you act systematically and can logically justify your decisions in your methods chapter.

Is Deductive-Inductive the Same as Abductive?

You might have heard of the third type of reasoning: Abduction. This comes into play when you encounter a particularly surprising result and try to explain it with what makes most sense based on the information you have at this point. Then you infer a rule or category that best explains this result. However, this is quite risky as you can’t verify if the rule is correct.

A typical example of abduction is the detective Sherlock Holmes. He looks for clues at the crime scene and abductively infers how the events might have unfolded. These inferences are often very bold but bring him closer to the truth.

However, abduction in qualitative research isn’t really something you can plan systematically. You can’t know if you’ll find surprising results where an abductive inference could help. Here, we can only adopt abduction as a general attitude towards surprising results.

The deductive-inductive method, on the other hand, can be systematically planned and implemented.

Categories
Research Methods

Triangulation in Research (Simply Explained)

Triangulation

Have you come across the term triangulation while working on your research paper? You might have a rough idea of what it means, but you’re not entirely sure?

Then sit back and relax.

In this video, I will explain briefly but precisely what triangulation in research is all about. Additionally, I’ll provide you with all four types of triangulation and how you can implement this technique.

This way, you can elevate your qualitative research design to the next level and make your research methodologically robust.

Triangulation (Word Origin)

You can easily derive the meaning of triangulation from Latin. “Tri” means three and “angulus” means angle. So, triangulation involves “measuring in a triangle,” a concept that originates from land surveying.

However, outside of land measurement and geometry, empirical social research has adopted this term. And that’s what we’re focusing on now.

Triangulation in Research

When we talk about triangulation, we are on a methodological level. It’s about how a specific research design can provide as much insight as possible using one or more methods.

While it is commonly associated with qualitative research, it can also be applied in quantitative and mixed methods research.

To avoid confusing you, let’s look at the definition of “triangulation” in the research context from our colleague Flick (2008, p.12):

“Triangulation involves taking different perspectives on a subject under investigation or more generally: when answering research questions. These perspectives can be realized in different methods applied and/or different chosen theoretical approaches, both of which are related to each other.”

The goal of triangulation is to gain deeper insights than would be possible with just a single method or a single theoretical perspective.

Using the metaphor of land surveying, the position of an object can be determined more accurately when viewed from at least two different angles.

4 Types of Triangulation

To help you apply triangulation in your scientific work, here are the four most prominent types (Denzin, 1970; Flick, 2011).

#1 Method Triangulation

This form is probably the most commonly used. Denzin, the father of triangulation, even distinguishes between within-method and between-method triangulation.

Within-method triangulation could involve using two different interview guides to loosen the constraints of methodological decisions when creating the research design.

Between-method triangulation would involve adding a second method as described earlier. In our example, you could distribute an additional online questionnaire to the employees or evaluate the user data of the system.

#2 Data Triangulation

With this approach, you need different data sources. The method can remain the same, as can the phenomenon you are investigating.

To vary the data sources, you can change time, location, and people. There are almost endless possibilities, as you can already triangulate within each of these dimensions.

Time

Let’s take an example. Suppose your method is limited to expert interviews. You conduct interviews in a company and want to accompany the introduction of a new logistics system. You could triangulate within the dimension of “time.”

You select your expert, such as the head of the logistics department. Provided the company agrees, you could conduct an interview with the expert at two or three different points in time.

Here you would gain wonderful insights, for example, into the time before the introduction, the introduction process, and the experiences after the system has been used in the company for some time.

Location

In the same scenario, you could also triangulate the location. You could find two other companies where the system is also being implemented. Then you interview the heads of the logistics departments in these companies.

This way, you can make comparisons and examine the “phenomenon,” whatever you are investigating during the system adaptation, from different perspectives.

Data Subjects

Additionally, and I always recommend this, you can triangulate the data subjects. In addition to the logistics manager, you could include a warehouse specialist and a mid-level manager.

Of course, you can triangulate all three dimensions, but this also increases the effort. Consider which type of data triangulation would provide the most value for answering your research question.

Investigator Triangulation

This type involves briefly switching sides. Two or more researchers can prevent subjective distortions or a so-called “bias” on the part of the researcher.

In our example of expert interviews, at least two interviewers would have to be used. It would not be enough for you to conduct interview 1 and your fellow student interview 2. You would have to do it together, take notes independently, and then compare your evaluations.

This type of triangulation is only really feasible if you work in a group.

Theoretical Triangulation

The last form of triangulation is quite exciting but also not easy for novices like you and me to implement. Before analyzing your data, you must be aware of your theoretical background.

This means which theory you use to understand the data or the phenomenon. Different theories offer different perspectives. In theoretical triangulation, you would apply several different theoretical frameworks to the data and view the phenomenon from different angles.

For example, you could develop a codebook for analyzing your interviews based on a behaviorist theory. Then, analyze your transcript again, this time with a codebook developed using a different sociological or psychological theory. Your imagination is the limit here.

Of course, always provided you argue well.

Triangulation in Research: Validation vs. Balance

To fully understand the concept of triangulation, it’s worth looking at the debate that has been carried out in the research literature over the past few decades.

It was Denzin (1978) who originally proposed triangulation as a strategy for validating research results. His idea was to use an additional method to ensure the accuracy of an analysis. But that this additional method is conducted on a much smaller scale.

This approach, however, has been repeatedly criticized (e.g., Mayring, 2001), leading more and more researchers to argue that different methodological approaches or theoretical perspectives should better be considered equal.

It is also important to understand that the research design in qualitative methods does not always have to be strictly predefined.

Most textbooks suggest a certain approach, with steps you should take, important quality criteria, and so on.

But in qualitative research, it is always possible to deviate from a blueprint if certain circumstances in your research require it.

Triangulation, too, should be understood as an open concept rather than something that needs to follow a strict guideline.

The Difference Between Triangulation and Mixed Methods

If you’re familiar with my article on mixed methods, you might wonder what the big difference is, since different methods are combined there too.

Mixed methods and triangulation are indeed two related concepts within empirical social research. They share similarities, such as the combination of different methods.

But: Mixed methods represent an independent research strategy that explicitly combines quantitative and qualitative methods to benefit from the strengths of both approaches.

Triangulation, on the other hand, is a much broader concept, which not only involves the combination of methods (although it can) but also includes theoretical perspectives and other subjective viewpoints.

Moreover, unlike in mixed methods, you can do what is called “within method” triangulation, which could be a combination of two different qualitative methods.

References

Denzin, N. K. (1978). Triangulation: A Case for Methodological Evaluation and Combination. Sociological Methods, 339-357.

Flick U. (2008). Managing quality in qualitative research. London, England: Sage.

Flick, U. (2011) Introducing Research Methodology: A Beginner’s Guide to Doing a Research Project. Los Angeles: Sage

Mayring, P. (2001). Combination and Integration of Qualitative and Quantitative Analysis. Forum Qualitative Sozialforschung Forum: Qualitative Social Research, 2(1).

Categories
Research Methods

Mixed Methods: Combining Qualitative and Quantitative Research

mixed methods

Are you pondering your research design and have been advised to look into mixed methods research?

Then you’ve come to the right place at the right time.

In the next few minutes, I will provide you with the basics of the mixed methods approach. You’ll learn when it makes sense to combine qualitative and quantitative data and analysis elements. Additionally, you’ll become familiar with the most common methodologies and some helpful foundational texts.

This way, you can quickly decide whether mixed methods are suitable for your work and where to continue your reading on this topic.

The Philosophical Backstory of Mixed Methods (Highly Simplified)

To understand the concept of mixed methods, it’s worth taking a brief look into the philosophy of science.

Epistemology refers to theories of knowledge and describes how researchers can convert reality to knowledge. In short: How is knowledge created?

In today’s research landscape, we can broadly distinguish between two prevailing epistemologies: Positivism and Interpretivism.

These camps have long debated which paradigm is the true one. In specific research disciplines like business studies, sociology, or political science, both camps can be represented.

Some disciplines are so dominated by one camp that the other is rarely recognized. For example, natural sciences are truly positivist – which means that there is only one objective natural world out there, which can be best represented by numbers and maths.

Some social sciences like psychology adopt this view and others are somewhere in the middle. Here, different philosophical stands are accepted and methodologies are followed. These methodologies are classically either qualitative (on the side of interpretivists) or quantitative (on the side of positivists).

Since the social sciences have become much more pluralistic, the combinations of these methodologies has become more common and the advantages of “the other side” are appreciated.

Mixed methods were born!

Definition of Mixed Methods

To speak of mixed methods, a study design must include both qualitative and quantitative methods.

This means that the study design is intentionally developed with this combination in mind, and the research question can only be answered through the combination.

The choice of method or combination should always be closely linked to the research question, research goal, and the context of the research.

The first question you should ask yourself is:

What added value do mixed methods offer compared to a study design with only qualitative or only quantitative methods?

To help you with this, here are some advantages of mixed methods that you can use to justify your study design.

Advantages of Mixed Methods

#1 Mixed Methods can simultaneously answer open and closed research questions

What does that mean?

Through the qualitative part of the study design, you can explore and answer an open research question (e.g., How does an infodemic, a spread of misinformation, propagate on social media?).

With the quantitative part, you can test specific hypotheses (e.g., a warning label indicating unverified third-party information reduces the spread of an infodemic), which helps answer a closed research question.

Additionally, qualitative methods and open research questions often aim at developing new theories (exploratory research), while quantitative methods and closed research questions typically test existing theories (confirmatory research).

#2 Mixed Methods can offset the weaknesses of each method

For example: Qualitative interviews can add depth to a scientific study, but often only a small sample of experts can be interviewed.

If you additionally send a quantitative online survey based on your interview findings to many more people, you achieve the breadth that a purely qualitative study couldn’t provide. This could, for example, increase the statistical generalizability of your findings.

The argument works in reverse as well.

#3 Mixed Methods can yield contradictory results

This might initially sound like a disadvantage. However, it’s not. Contrasting results from both approaches can provide a deeper understanding of the phenomenon and highlight the limitations of each single methodology. This leads to more discussion points and more nuanced results.

Should mixed methods always be used then?

No, of course not. It all depends on the research question, research goal, and context. If your work aims to test existing theory, incorporating qualitative elements might not make much sense.

If you are at the early stages and exploring a topic scarcely covered in existing literature, you might focus on qualitative exploratory research only.

mixed methods 2

Implementing Mixed Methods

When implementing a mixed methods study, you need to be clear about why you are doing it. This will also determine the study design and the chronology of implementation. Here are the three most common variants of mixed methods designs.

#1 Complementation

In this variant, qualitative and quantitative elements are equally prioritized and are intended to provide complementary results on the investigated phenomenon.

Order: Quantitative (50%), then qualitative (50%). Or vice versa.

#2 Completion

In this variant, one of the methods is prioritized and subsequently supported by the other to ensure the phenomenon is fully covered.

Order: Quantitative (90%), then qualitative (10%). Or vice versa.

#3 Sequential Designs

The most common mixed methods studies follow a seuqential design. This means you complete one method first, and then start with the other.

Explorative sequential design

A qualitative study is used to develop constructs or hypotheses, which are then tested with a quantitative study.

Order: Qualitative (exploration), then quantitative (testing).

Explanatory sequential design

First, A quantitative study is used to test hypothesis. Second, a qualitative study follows to understand “why” these results occured.

Order: Quantitative (explanation), then qualitative (understanding).

#4 Parallel Designs

The alternative to a sequential design is a parallel mixed methods design. Here, you conduct multiple methods at the same time.

In this case, the second study does not build on the results of the first, but instead, the results of both studies are compared and contrasted once they are completed.

Validating Results

For mixed methods research, validating the results is an important quality criterion.

For quantitative data, there are well-standardized calculations (e.g., Cronbach’s Alpha) that can validate constructs using SPSS or similar programs.

For qualitative data, the validation process is much softer, and there is less consensus on the standard. Leung (2015) suggests these five criteria:

  • Does the research question align with the analysis results?
  • Is the chosen methodology suitable for answering the research question?
  • Does the research design match the methodology?
  • Is the sample appropriate for studying the phenomenon?
  • Do the results and conclusions fit the sample and the research context?

You basically apply the same techniques to ensure validity and reliability as you would for just one method (Venkatesh et al., 2013). Now you do it for two. This is why mixed methods often means more workload, but in the end, you also have a more valuable study.

What is the difference between mixed methods and Triangulation?

In mixed methods, your qualitative and quantitative parts are typically treated equally. If one method is only worth 10% or so, then you can speak of triangulation.

The purpose of triangulation is to provide additional perspectives to the object under study, for example by adding additional researchers, another theoretical perspective, or addition data that is all different from the main study.

Mixed methods is highly respected because it has some aspects of triangulation already built-in. However, you can also perform triangulation without using quantitative and qualitative elements. Therefore, mixed methods and triangulation are related concepts but not the same!

What to read next?

If you now want to deepen your understanding, I suggest you get your hands on a copy of Creswell and Clark’s “Designing and Conducting Mixed Methods Research” (2010).

It is one of the standard methods book on this topic and it is applicable for any social science discipline!

Categories
Research Methods

Empirical Research Methods (Quantitative vs. Qualitative)

empirical research methods

Finding the right empirical research methods for your academic project can be challenging, whether it’s a term paper, thesis, or dissertation.

On my channel, you’ll find extensive information and tutorials about specific methods and techniques, such as grounded theory, experimental design, or survey research.

But before you dive headfirst into applying a particular method, it’s essential to take a step back.

First, it’s crucial to understand which empirical research methods are out there, and which ones are suitable for your current situation.

Based on a 5-step process, this article will guide you on how to select the best method for your research design.

What are empirical methods in research?

The starting point for questions like this article is always the field of philosophy of science. I will attempt to simplify the basic assumptions here, but still provide helpful insights for your practical application.

Philosophy of science deals with the question of how we, as researchers, can gain knowledge or understanding. Despite centuries of philosophical deliberations and different schools of thought, it has become clear that science operates quite well with the dichotomy of theory and empiricism.

Theory preserves knowledge at an abstract level and provides frameworks for specific phenomena. It waits to be challenged, strengthened, refuted, or refined by new insights.

Empirical investigations are situated one level below theory, closer to the real-world subject. Methods are the tools and practices used to acquire new knowledge based on real-world phenomena. This process can inform theory and vice versa.

empirical research methods 2

#1 Position Yourself in a Discipline

Then there’s the administrative side of science. A few centuries ago, it was much looser, and scientists like Isaac Newton, for example, were simultaneously physicists, philosophers, and theologians.

Today, science is sharply divided into distinct disciplines and communities. Each discipline has its own theories and methods, but fortunately, the dogmatism of these individual disciplines is being slowly dismantled, and researchers often draw from the knowledge of so-called “reference disciplines” and engage in interdisciplinary research from time to time.

This trend is also reflected in the study programs that are offered by universities. For example, today, there are fields like Business Informatics or Social Work, where students work at the intersection of two or more disciplines.

No matter what you’re studying, you should first understand which scientific discipline(s) your field of study is related to. If you’re studying in a highly specialized field like mathematics, philosophy, or psychology, the situation is very clear.

If you’re studying at an intersection, be aware of which disciplines are relevant to you. This may also change over the course of your studies or from one project to another. For example, a Business Informatics student may be methodologically and theoretically focused on computer science in one assignment but may rely on insights from business literature in another.

#2 Identify the Methodological Toolbox of Your Discipline

To decide which methods you should use in your next project, you need to find out which methods are common in the disciplines that inform your studies. It makes little sense to develop new methods or question the entire discipline as a student.

You just need to discover what is already in the toolbox.

The quickest way to do this is actually through textbooks. I’m not typically a big fan of books because the publication process is slow, and the knowledge can become outdated shortly after publication.

However, methods books and other textbooks can be useful for gaining an overview as a newbie. Often, they are authored by selfless professors who compile the basics of a particular field in a single book!

In such textbooks, you’ll usually find an overview of common methods. Additionally, you can search databases for journal and conference articles to see which methods are used in current research in your field.

Ideally, your study program offers methods courses to choose from. However, this is not always the case. If they are available, attend them, even if they are not mandatory.

empirical research methods 3

#3 Distinguish Between Empirical and Non-Empirical

In most disciplines, there is some sort of split between empirical and non-empirical work. Sometimes, the empirical part is more dominant, for example in Psychology. Other disciplines are more inclined to non-empirical research but sometimes use empirical methods, for example Media studies.

Non-Empirical

When a discipline mostly follows a non-empirical approach, it doesn’t mean it is less valuable or less scientific. It simply means that the nature of the discipline leans toward understanding socially constructed or abstract phenomena and relies on (inter-)subjective argumentation.

Examples of disciplines primarily using non-empirical methods include philosophy, theology, other humanities, and the unique discipline of mathematics.

Empirical

Empirical research seeks to gain knowledge through “experience,” which is achieved by systematically collecting and analyzing data from the “real world.”

Originally, the role model for empirical research were the “hard” sciences, meaning the natural sciences such as physics, or chemistry.

However, many social sciences adopted the same approach and since then try to objectively measure all things related to social phenomena.

But since the last 50 years or so, many social sciences are also influenced by the humanities, which bring in non-empirical or subjective ways of collecting data.

#4 Consider the Research Paradigm (Qualitative vs. Quantitative)

Especially within empirical social research, there has been an ongoing battle between qualitative and quantitative researchers.

An explanation and differences between these two paradigms are summarized in my article “Qualitative vs. Quantitative.”

For these basics, please refer to that article, and I will now introduce you to the most common methods in both areas.

Quantitative:

Surveys, experiments, simulations, trace data analyses, etc.

Quantitative methods emphasize standardization. Collected data must have a format in which it can be easily translated into numerical values and statistically analyzed.

This allows you to examine large samples.

The foundation for quantitative research often includes a research question and specific hypotheses that you define upfront.

This is also referred to as a hypothetico-deductive approach, and simply means that your goal is to test the relationships between a number of theoretical constructs.

Qualitative:

For qualitative methods, it makes sense to distinguish between data collection methods and data analysis methods.

In terms of data collection, interviews (e.g., with experts, focus groups, individuals) and observations are the most prominent ones. But you could also collect data from online sources such as social media or a City archive, for example.

To analyze qualitative data, you can use grounded theory techniques, content analyses, or more computational methods such as topic modelling.

For most qualitative methods, interpretation and depth of the investigation play a significant role. Hence, you tend to examine smaller samples.

This often follows an inductive approach, which means that you develop new theory rather than testing existing theory in new combinations.

#5 Make your choice in line with your research question

The research question plays a crucial role in selecting the right method for you.

You must first know what you want to investigate before making a decision about the method.

This means that a method must be suitable to help you answer your research question.

I provide detailed guidance on how to formulate a research question in another article.

Here are five questions that can help you make a choice:

  1. What foundational skills have you already acquired? (e.g., statistics, qualitative coding)
  2. Does your department or supervisor lean more towards qualitative or quantitative research?
  3. How extensive is the existing theoretical basis of the phenomenon you are studying?
  4. Which method aligns with your personal strengths? (e.g., are you good with numbers or a creative writer?)
  5. Which method would be the most enjoyable for you?

Summary

In academia, theories and methods aid in the acquisition of knowledge. Academia is organized into disciplines, each with its own methods and theories.

Your research can be empirical or non-empirical. Empirical research distinguishes between natural science and social science methodologies.

In empirical social research, two paradigms, quantitative and qualitative, are prevalent.

Your choice of method depends on your research question, your existing skills, and your preferences.

Categories
Research Methods

Operationalization of Variables in Quantitative Research

Have you encountered the term Operationalization in the realm of empirical social research during a lecture or while reading a methods book?

Maybe you’ve been assigned the task of operationalizing one or more variables for an assignment or research project?

But you just don’t know what on earth all these people are talking about?

The issue lies in the fact that many university instructors are so well-acquainted with this term that they often struggle to empathize with beginners.

They use terms like variables, concepts, constructs, and operationalization without offering the fundamental knowledge that someone new to this type of work requires to understand how these things are interconnected.

In this article, my goal is to clarify these terms and elucidate, in the most straightforward language, how they are related. We will also explore what operationalization entails and how you can put it into practice with regard to variables in your own study.

Operationalization

The World of Quantitative Research

In the realm of empirical social research, one of the fundamental distinctions lies between the qualitative and quantitative research paradigms.

This division finds its origins in the philosophical underpinnings of the social science, which I’ve explored in-depth in my article on Ontology, Epistemology, and Methodology.

Operationalization is an important task within the realm of quantitative social research.

The quantiative paradigm is characterized by its goal of testing theoretical assumptions, mostly through the use of statistical methods.

The bedrock of these statistical methods is grounded in quantitative empirical data, such as survey responses or the outcomes of experiments, or digital trace data.


Theoretical Building Blocks (Concepts and Constructs)

The currency of the social sciences is theory. Social science theory relies on linguistic elements, even within the quantitative paradigm. In contrast, mathematicians and physicists build their theories with numbers and equations, reflecting the philosophical assumptions and nature of these disciplines.

Social science theories require the use of ‘concepts’ as foundational elements. These concepts serve as the vocabulary employed by researchers when describing existing theories or building new ones.

Qualitative researchers tend to be more at ease with this aspect, as they enjoy crafting new concepts to enrich the theoretical landscape and to describe emerging social phenomena.

On the other hand, quantitative researchers find the conceptual level less satisfying, often considering it too ambiguous. For instance, the concept of ‘intelligence’ can have diverse interpretations. Not everybody agrees on what ‘intelligence’ means.

In the context of quantitative research, however, concepts are transformed into ‘constructs.’ Constructs are concepts made measurable. And this is what a quantitative researcher aims to do. (Döring & Bortz, 2016).

Operationalization

The process of making concepts measurable is referred to as ‘operationalization,’ and it introduces a new component – variables.

A completed construct can encompass one or multiple variables, resulting in constructs that are then called unidimensional or multidimensional.

Unidimensional Constructs

An instance of a construct that can be determined by measuring a single variable is ‘weight.’ If we can measure weight in kilograms using a scale, then assessing the construct ‘weight’ is relatively straightforward.

Multidimensional Constructs

However, many other constructs that researchers aim to measure are more complex.

For instance, the construct ‘intelligence’ cannot be assessed through a single variable. To make assertions about intelligence, researchers may consider variables such as ‘abstract thinking,’ ‘communication skills,’ ‘learning,’ ‘problem-solving,’ and more.

During the operationalization of a multidimensional construct, researchers must decide which variables are relevant to the concept and which ones should be included in their study.

Conversely, it is important to note that a single construct can be operationalized in various ways. For example, a study that solely employs the IQ variable to measure intelligence might face criticism, because intelligence involves more than just the result of an IQ test.

At the same time, even if a researcher picks a handful of variables to measure ‘intelligence,’ another researcher might pick 5 other variables, for example.

Measurement Instruments

In the realm of quantitative research within the social sciences, researchers often rely on a method called ‘items’ or ‘item batteries’ for data collection.

These item batteries consist of pre-designed sets of questions that can be incorporated into a questionnaire.

Researchers can either create their own item batteries or utilize existing ones from the literature.

If you are new to all of this, I would suggest the latter option. Many experienced researchers have already put in the effort to test and evaluate these item batteries.

This also means that you can measure a single variable in various ways.

For instance, if you intend to measure ‘abstract thinking,’ there might be multiple item batteries or scoring systems provided by different authors to consider.

In the process of operationalization, it is crucial to make well-informed selections and provide strong justifications for your choices.

You must consider what different batteries cover and which measurement instruments are widely accepted within the research community.

One indicator of this is the number of citations for the publication where the measurement instrument is made available.

Additionally, the quality of operationalization can be assessed by examining the reliability and validity of the measurement instruments.

If you’d like to delve deeper into this topic, take a look at my tutorial on Reliability, Validity, and Objectivity.

Beyond item batteries for surveys, there are various other methods of operationalization. The core principle remains the same, even if your method involves other types of data collection.

In any case, it is essential to engage with the existing literature and determine how you can gain meaningful insights about the variables you are interested in.

Theoretical Assumptions (Propositions and Hypotheses) for Operationalization

To complete this tutorial, we must address the following question:

After identifying your measurement instruments and conducting your analysis, what comes next?

In addition to the theoretical building blocks, which are your constructs, there are the connections or relationships that hold them together.

In quantitative research, the goal is not necessarily to discover new building blocks, but to provide insides about the relationships between them.

Theoretical relationships are tested by identifying causal relationships (primarily based on experiments) or correlational relationships (e.g., through surveys). These relationships are typically assessed for statistical significance.

Theoretical assumptions guide what should be tested. These assumptions are derived from the existing literature.

In this context, propositions are assumptions about how concepts are related, while hypotheses are assumptions about how measurable variables or constructs are related.

When formulating hypotheses at the start of your study, you are not only selecting the theoretical building blocks (e.g., Variable A and Variable B are relevant) but can also make predictions about their relationship (e.g., Variable A positively affects Variable B).

For more information on hypotheses, you can refer to my other tutorials on hypothesis development.

Conclusion on Operationalization

If you now have a basic understanding of what operationalization entails, this video has fulfilled its purpose. However, it’s crucial to delve further into this topic. As the next step, I recommend reading a methods book. A good starting point is Discovering Statistics by Andy Field.

Categories
Research Methods

Thematic Analysis in Qualitative Research (Braun & Clarke 2006)

You’ve come across Thematic Analysis according to Braun and Clarke (2006) and are wondering what this qualitative research method is all about?

No problem.

In this article, you’ll learn:

  1. The 6 steps of Thematic Analysis according to Braun and Clarke.
  2. The different types of Thematic Analysis you can do.
  3. The difference between Thematic Analysis and qualitative content analysis.
  4. The types of research projects for which Thematic Analysis is particularly well-suited.

By the end of this article, you won’t just have added another qualitative method to your toolkit, but you’ll also know when to best employ each one.

Thematic Analysis according to Braun and Clarke (2006)

Thematic analysis is one of the most popular qualitative research methods out there. Since Braun and Clarke published their paper “Using Thematic Analysis in Psychology” in 2006, it has been cited over 150,000 times. Therefore, the method has gained recognition far beyond the realms of psychology and is used across various disciplines.

The reasons for the popularity of thematic analysis are manifold.

Unlike Grounded Theory, it represents a specific method rather than a methodological approach. This means that there are concrete steps for its execution that have been clearly and explicitly defined.

Moreover, thematic analysis still offers a certain flexibility, which is essential for qualitative approaches.

The method has evolved very little since 2006, meaning the guidelines by Braun and Clarke are still highly relevant.

However, since then, the duo has distinguished between three different kinds of thematic analysis. This differentiation arose because the method was sometimes interpreted in ways different from what they originally intended.

The three types are as follows:

Reflexive Thematic Analysis

This is the method as Braun and Clarke envisioned it. It’s based on a constructivist mindset, meaning subjective interpretations of the data are at the forefront.

Positivist Thematic Analysis

In this variant, researchers compute a reliability measure to check for agreement among them. This version follows more of a positivist mindset and isn’t quite what the two originally had in mind.

Thematic Analysis with a Codebook

This third variant is neither one extreme nor the other. It involves working with a codebook, which can contain predefined categories but can also be expanded spontaneously.

What is a “Theme”?

A Theme is either…

…a summary of the content

or

…a central concept that encapsulates the meaning of similar content.

Themes cannot be discovered or found within the content. They have to be generated by you. So never write: “I identified 5 themes…” but instead say “I developed 5 themes…”

6 steps of reflexive thematic analysis as proposed by Braun and Clarke (2006)

What follows are the 6 steps of reflexive thematic analysis as proposed by Braun and Clarke (2006).

#1 Familiarize yourself with the data

First, transcribe your data if you have it only in audio or video format.

Then, read the entire dataset twice from start to finish. This gives you a good overview of all your material. It’s better than starting to evaluate a transcript without knowing the rest.

Try to fully immerse yourself in the situation described in the transcripts. However, always maintain an analytical perspective.

Take notes as you read. You can also take notes right after conducting an interview or while visiting a company on-site if that’s your research context. All your notes are for your personal use; you don’t need to share them later. However, they will assist you in the evaluation later on.

In your notes, jot down your initial reactions. These can be analytical or purely intuitive.

#2 Generate initial codes

Now it’s time to start coding. The codes that emerge at this stage are categories, but not themes yet!

What are categories?

Try to code all your data according to the same schema. That is, find categories on a consistently similar level of abstraction.

An example of a category would be “democratic decision-making within the team.”

Another category on the same level could be “open discussion about the integration of new technologies.”

Two categories that aren’t on the same level might be “hierarchy” (too abstract) or “weekly meetings where personnel decisions are made” (not abstract enough).

With the categories, you can certainly venture a preliminary interpretation, like “democratic decision-making”. This exact phrase wasn’t in the data; it’s something you interpreted.

But what’s the purpose of the categories?

The categories reduce the volume of your data and group your analytical units.

What’s essential for Thematic Analysis as per Braun and Clarke is that you don’t code EVERYTHING. Instead, you should only form categories that are relevant to your research question.

In the data, you’ll find many sections that just aren’t interesting and won’t help answer your research question. You don’t need to code these sections.

The naming of your categories should be chosen such that they precisely describe what’s relevant to your question. A category doesn’t have to consist of just one word; it can be a bit longer (3-6 words).

How to Code?

You can either work digitally with software like NVIVO or use pen and sticky notes. I’m more of a software person. But everyone has their own preferences.

Even while coding, you can and should continue to take notes that you can use later on.

#3 Generate the First Themes

The reflexive Thematic Analysis by Braun and Clarke operates inductively. Your themes should arise exclusively based on your data and, at this point, based on your codes.

Now, group the codes. Which ones are thematically related? This will lead to clusters of categories. Each cluster will then become a theme.

Here, you can also work with mind maps and visually develop the clusters. It’s also possible that within a larger cluster, you have smaller clusters (or “subthemes”). However, try not to make it too complicated.

In the end, having 3 to 6 themes is a good amount to work with.

Avoid Thematic Buckets

The biggest mistake in coding and also in generating themes is the use of so-called “buckets”. A classic bucket includes categories like “Advantages”, “Disadvantages”, “Barriers”, and “Challenges”. It’s crucial to steer clear of these.

#4 Review Your Themes

Once you’ve finalized all the themes, create a final mind map featuring all the themes, potential subthemes, and categories.

Check if everything forms a coherent overall picture and accurately reflects the content of the data. Ask yourself the following questions for each theme:

  • Is this more than just a category?
  • Does this theme encapsulate multiple categories?
  • How does the theme relate to the research question? Are there overlaps between themes?
  • Is there sufficient data supporting the theme?
  • Is the theme too broad or too specific?

If you encounter issues with these questions, such as overlapping themes, take a step back and rephrase the themes or rearrange the structure.

The Thematic Analysis by Braun and Clarke isn’t a linear process; you can always move forward and backward as needed.

#5 Define and Name Your Themes

Write a detailed description for each theme, comprising 5 to 6 sentences.

Also, finalize the specific designation for each theme.

If you encounter issues while describing or naming, it typically indicates that the theme isn’t distinct enough. In such cases, revert a step or two and reconsider.

Thematic Analysis according to Braun and Clarke

#6 Write Down Your Findings

The final step for your Thematic Analysis according to Braun and Clarke involves drafting your report.

In most instances, this will be an academic paper.

Now, you will integrate your findings with existing literature and align the motivation, research question, results, and discussion.

In your methodology section, ensure to cite Braun and Clarke (2006) and explain how you approached your thematic analysis.

In the results section, introduce all the themes at a glance and then delve deeper into each specific theme. Provide quotes from your data that represent each theme.

Certainly, let the quotes speak for themselves. They can even be a bit lengthy. However, simply stringing together quotes isn’t sufficient. Between them, you must jot down your interpretation and establish the connection between the data and the theme.

What’s the difference between Braun and Clarke’s Thematic Analysis and Qualitative Content Analysis?

Answering this question isn’t that straightforward. The approach suggested by Braun and Clarke is simply their perspective on systematically evaluating qualitative data.

With qualitative content analysis, there are different variants too, for example by the German social scientists Mayring or Kuckartz.

A content analysis would probably be more suited if you have a big qualitative data set and would like to count your categories or if you want to develop a codebook for other researchers to use.

The procedures of thematic analysis and inductive content analysis are quite similar and differ by maybe one or two steps and their respective labels.

When selecting your method, consider the target audience for your research. For more interpretative research and an English-speaking audience, choose thematic analysis.

For a more structured approach and some quantification of your qualitative data, choose content analysis.

Categories
Research Methods

The Gioia Method for Grounded Theory (simply explained)

Have you stumbled upon the Gioia Method while looking for a suitable research method?

Now you surely want to know if this approach is a fit for your qualitative study and how the method distinguishes itself from conventional Grounded Theory methods.

Great that you’re here! Because that’s exactly what you’re going to learn about in this article.

After learning where the Gioia Method originated and what its purpose is, I’ll explain to you how to use the Gioia Method in 5 steps.

After this article, you can immediately start to analyze your qualitative data and impress your supervisor.

So, “sit back, relax, and enjoy the show!”

Where does the Gioia Method come from?

The Gioia Method was named after Professor Dennis Gioia. In the 1990s, the management scholar began, along with various co-authors, to use Grounded Theory in his research.

Already in the 1960s, Glaser and Strauss had developed the Grounded Theory approach. However, it took time for it to establish itself in disciplines other than sociology.

Gioia and his co-authors consistently received the same feedback from the review panels of management journals:

The article is wonderfully written, and the theoretical value sounds promising, but how do we know whether this is truly a result based on your interview data or if you’ve just made it up?

The application of Grounded Theory was largely limited to researchers who, following the paradigm of interpretivism, sought to counteract the prevailing positivist paradigm, or in other words, the dominance of quantitative research.

These early Grounded Theory studies were fundamentally different compared to what quantitative researchers perceived as scientific.

And that was a problem.

Gioia responded by developing his own way of doing Grounded Theory.

What is now called the Gioia Method aims to address the poor reputation of qualitative research by introducing more rigor into the theory development process.

In 2013, Gioia et al. published an article that explained the approach from A to Z.

Gioia Method

When should you use the Gioia Method?

The Gioia Method is suitable for inductive, qualitative-interpretivist research.

In most cases, the foundation for this is data from interviews.

However, the Gioia Method can also be applied to other types of data, such as during literature reviews or for the analysis of documents or social media posts.

For those who find the classic Grounded Theory a bid elusive, they might take a liking to the Gioia Method.

In my view, it’s somewhat easier to grasp and provides a more explicit pathway on how to progress from interview data to your very own theory.

The Gioia Method in 5 Steps

#1st-Order Concepts

The data analysis starts with the formation of so-called “1st-Order Concepts”. This step is comparable to the open coding of the original Grounded Theory approach.

Here, you categorize the data and primarily use the language you find within the data.

You do not have to find very abstract categories or need to do a lot of interpretation. As coding units, you take single statements. You can also code every sentence if you want to be really serious about it.

According to Gioia, from just 10 interviews, one could derive 50 to 100 1st-Order Concepts. These concepts don’t have to be just a single word; they can also be short sentences. I’ll show you an example of this in Step 4.

#2nd-Order Themes

Next, you’ll sift through the 1st-Order Concepts, attempting to group them logically.

Can you see a pattern here?

If so, you can now identify more abstract categories that consolidate several 1st-Order Concepts.

With these abstract categories, you’ll distance yourself from the exact wording of the data, crafting themes with your own language.

If you already have an idea of how these emerging 2nd-Order Themes relate to each other, all the better. You can also begin sketching that out. This process is analogous to axial coding as introduced by Strauss and Corbin (1998).

Once you reach this juncture, it’s time to gather some fresh data.

Here, you can specifically seek experts who can tell you more about what you already found.

This is called theoretical sampling and is a hallmark of classic Grounded Theory.

Data collection ceases when you no longer uncover new 2nd-Order Concepts (also known as “Theoretical Saturation”).

#3 Aggregated Dimensions

Once the data collection is complete and you have coded them all, you consolidate your 25-30 2nd-Order Concepts once more.

This results in approximately 3-5 theoretical dimensions.

Ideally, these should be original and describe your observed phenomenon in a way no one else has done before.

#4 Form a Data Structure

Now comes the step that sets the Gioia Method apart. From the formed 1st-Order Concepts, 2nd-Order Themes, and aggregated dimensions, you’ll create what’s known as a data structure.

This is essentially a horizontal diagram that demonstrates how the 2nd-Order Themes emerged from the 1st-Order Concepts and how the aggregated dimensions arose from the 2nd-Order Concepts. You’ll then incorporate this as a figure in your methodology chapter.

This data structure allows readers to better understand how theoretical concepts have been derived from the data.

Gioia Method 2

#5 Develop a Grounded Theory Model

However, the data structure is not the final outcome of the Grounded Theory study as per the Gioia Method.

While it does showcase all the theoretical components of the new theory, it remains static.

What’s missing now is integrating the dynamics and processes you’ve observed.

This means that your focus will now shift to the relationships between the concepts. Typically, a number of arrows assist in this phase. 😉

In Gioia et al.’s example on page 23, you can see how the aggregated dimensions and the 2nd-Order Concepts reappear in the model and how they are connected to each other.

Often times such a model is an inductive process model. Such a model explains a process by showing some practices that are involved in this process.

It is not necessary that the first-order concepts appear in the model, but there should be a clear connection between the data structure and the final model.

For example, the aggregated dimensions could be three phases within the model or three central practices.

If you can arrange your themes and dimensions in a way that answers your research question, you have successfully applied the Gioia method and derived your very own grounded theory!

Conclusion

Gioia et al. emphasize in their article that the approach is more akin to a methodology rather than a concrete method, even if it’s referred to as such.

This implies that deviations from this process are not only possible but also intended.

Each study is unique, and you shouldn’t rigidly adhere to individual steps if, from your perspective, a deviation from the guidelines makes sense.

However, according to Gioia et al., it’s crucial in such cases to meticulously describe the exact process of your analysis in the methodology section of your work.

Even if deviations are permissible, the defining characteristic of the Gioia Method is its structured and systematic approach.

Categories
Research Methods

Case Study Research Methodology (A Beginner’s Guide)

You would like to apply the case study research methodology to you next academic paper or thesis?

Then you should stop everything else right away, because in this article you will get a super fast and effective beginner’s tutorial on how to conduct a case study.

In only 6 easy-to-follow steps you will learn the basics of case study research and how to apply them.

What is the case study research methodology?

Case study research is often used in social sciences. It investigates a current phenomenon that can be observed in our world (as opposed to, for example, historical events or natural laws).

This phenomenon is always anchored in a specific context, which must be taken into account throughout the entire case study. A possible context can be an organization, a country, or even a single person.

The case needs to provide the context in which the phenomenon under investigation can be observed.

In a case study, the researcher has no influence on the events (as opposed to, for example, an experiment in a laboratory). Rather, data is collected in the field or from third parties about that case to analyze the phenomenon and to arrive at theoretical and/or practical conclusions.

Both qualitative approaches (such as interviews and grounded theory) and quantitative methods (such as surveys and statistical tests) can be used in data collection and analysis. The special feature is that the research focuses only on one specific “case”.

Comparative or multiple case studies are special forms of case study research that relate and contrast several cases to each other.

A case study always answers a specific research question, which is best started with “how” or in rare cases also with “why”.

Who should use a case study research methodology?

As mentioned earlier, a case study is a methodology that is popular in the social sciences. Those include economics, psychology, political science, and so on.

Natural sciences and humanities do not fall under this category. However, as interdisciplinary research and teaching are almost everywhere nowadays, it is not impossible that case studies can also be used here. Case studies are therefore a quite common and widely used research methodology.

Critics of this method claim that case studies are too “soft”. This means that they have little explanatory power due to their descriptive research design. This can be countered by collecting unique data and analyzing it empirically, resulting in a “harder” case study.

Moreover, critics would claim that a lack of generalizability is a limitation of case studies. This is true, but only for statistical generalization. Other forms of generalization are possible with case studies but are often not considered.

Differences exist here both between different disciplines and cultural backgrounds. For example, case studies in European management literature must be quite “hard”. In the United States, on the other hand, case studies are often written quite “soft” and rely on the storytelling and interpretative abilities of the authors.

Especially for a dissertation, a case study is a great option. Depending on your data collection possibilities and methodological training, a dissertation can move freely on the spectrum from “soft” to “hard”.

Conducting a Case Study in 6 Steps

Now that you have all the background information, let’s move on to the 6 steps you can follow to write a case study.

I mainly rely on the work of Robert K. Yin and the 2014 version of his book “Case Study Research: Design and Methods”.

You can find the book linked below the video and in any well-organized university library.

Whenever you want to use the case study research methodology in academia, you should refer to at least one source in your methods chapter that has established generally accepted rules for the process. In Yin’s book, you will also find an overview of the most important sources for each research discipline.

Planning your case study #1

First and foremost, you need to decide that you want to conduct a case study. But that’s not enough. You should carefully consider why a case study is preferable to other methods.

  • Why is a literature review, a survey, or an experiment unsuitable?
  • What are the advantages of a case study in your situation?
  • Is a case study even possible with your resources?

You should have an answer to these questions and discuss them with your supervisor. Planning also includes formulating a research question.

To conduct a case study you need a relevant research question. Start with the question word “how” and proceed slowly. There are two possibilities:

  • Case-specific research question (e.g., “How does Volkswagen respond to hate speech on Twitter in the wake of the Dieselgate scandal?”)
  • Generic research question (e.g., “How do large companies respond to hate speech on social media?”)

Both approaches are possible and have their advantages and disadvantages. The research question should always be discussed with your supervisor.

case study research methodology

Setting up the research design #2

Now it’s time to set up your research design. The crucial questions here are:

Which method(s) can be used to answer my research question?

And:

What data do I need for that?

In my example, I could proceed as follows: I construct my case study backwards. I could answer my research question by identifying various strategies in the Twitter replies of the VW Group.

I could do this by collecting a dataset of relevant tweets (e.g., using the hashtag “Dieselgate”) and applying qualitative content analysis.

Can I answer the question differently?

Sure. In theory, I could also interview VW employees and have them answer the question.

Which approach you choose also depends on the possibilities you have to obtain data.

Preparing for data collection #3

Now it’s time to prepare. Just follow these three steps:

Create a literature review

Before you do any research, you have to read. Conduct a thorough literature review that reflects the current state of research.

(And if you are a bit more advanced:)

Is there a theory that can explain your case study?

In this case, establish a theoretical background. You do this by focusing on a theory that helps you understand the phenomenon under investigation. You then discuss your results in relation to this theory.

Identify data sources

Where do I get my data from?

Which interview partners do you need, which social media platforms, which company data? Which archive reports?

Contact the right people

Now all you have to do is get access to the data. Write to interview partners, call archive owners, and so on. Create a table with all your data sources for better overview and keep a diary of your progress.

  • Whom have you already contacted?
  • Who responded positively?
  • Were there any rejections?

This way you can meet your desired timeline and optimize your project management.

case study research methodology shribe

Data collection #4

The fourth step according to Yin is actual data collection. Again, this can look completely different depending on your research design.

If you conduct interviews, I just apply the method as you would normally do. Remember that a case study is a methodology and not a method.

This means that you are flexible in the methods you choose.

At this point, the literature review should be completed and already written up.

Data analysis #5

The most work when conducting a case study awaits you in the analysis. In “hard” case studies, of course, a little more than in “soft” ones. When analyzing your data, follow a few guiding questions.

  • How can your data be described?
  • Do the data have special characteristics?
  • What patterns can be identified here?

Collect your results digitally and make enough backups. Nothing is more annoying than losing days of work. Use software wherever possible, because you are not the first person to conduct such an analysis. Smart software solutions make pretty much every research method easier.

Interpreting the results #6

Finally, you filter the important results from the unimportant ones and present them “from general to specific” in the results section of your manuscript.

These 3 elements are essential for an outstanding case study:

  • Figures (e.g., flowcharts, bar charts, or pie charts)
  • Tables (e.g., with absolute or relative values of your analysis; results of statistical calculations such as frequencies or correlations)
  • Explanatory text between the visual elements that shows the reader which of the results are particularly noteworthy

In another chapter, you discuss the results in relation to:

  • Your specific case
  • General conclusions or implications (to theory)

Note that the results of a case study are not generalizable in a statistical sense. However, other generalizations are possible if your reader is willing to make some judgement calls.

For examples, this means that you should not draw conclusions about all other car manufacturers from VW. However, you can advise the reader to transfer the findings onto a another case if they are willing to accept that this case is similar enough to VW.

Moreover, case studies are great if researchers want to develop new theory. This is why case study research methodology is often combined with techniques from grounded theory.

Categories
Research Methods

Dependent and Independent Variables in Research (made easy)

Have you ever wondered what the distinction between dependent and independent variables is?

Then you’ve stumbled upon digital gold.

In this article, I will explain to you shortly but precisely what the difference between dependent and independent variables is and what function they play in your quantitative research design.

If you’re still interested after that, I will go a bit more in-depth and explain why this designation of variables in the context of survey studies and other methods is often not correct and how to correctly describe them.

Why do you need dependent and independent variables in a quantitative research design?

In a quantitative research design, your goal is to test a theoretical relationship. One of the building blocks of theory constructs that consist of variables.

In order to test a hypothesis in a quantitative research design, you must first determine the variables of that hypothesis and ensure that you can measure them.

As the name suggests, variables can change. They can experience various forms of change, for example, changing human behavior such as the tendency to choose more organic fruit at the supermarket.

Similarly, a variable can vary by location, such as in counties with the highest subsidies on organic fruit. Moreover, a variable can change over time, such as a fruit vendor’s profit per quarter.

Independent variables are the variables that are manipulated or changed in order to observe the effect on the dependent variable. In our example, the independent variable would be the type of fruit (organic vs. non-organic) and the dependent variable would be the number of fruits sold.

Variables in hypotheses

A hypothesis typically includes two variables and their relationship to each other. It’s about how one variable affects the other, i.e. the hypothesis expresses a relationship between cause and effect.

H: Eating a banana immediately after exercise increases muscle regeneration.

In this hypothesis, eating a banana is the cause. This is the independent variable.

Increased muscle regeneration is the expected effect. This is the dependent variable.

dependent and independent variables

Independent Variables

Ok, and why is the first variable now independent?

That’s because this variable can be varied arbitrarily. The variable could also be “drinking a protein shake”. Or: eating two bananas.

In that sense, this variable does not depend on other variables – hence independent variable.

Dependent Variables

The second variable, which represents the effect, is called dependent because the value of this variable depends on the cause.

In reality, however, independent and dependent variables are often not as clear-cut as they may seem. In many real-world situations, multiple variables can be both independent and dependent at the same time, depending on the specific research question and the level of analysis.

For example, in a study looking at the relationship between income and education, income could be considered the independent variable at the individual level, but when looking at the relationship at the societal level, education could be considered the independent variable.

Additionally, it’s important to note that the cause-and-effect relationship between independent and dependent variables can be difficult to establish as it may be influenced by other factors. That is why we need experiments.

Dependent and independent variables in experimental designs

These terms originated in the context of scientific experiments. To test the example hypothesis, you could set up an experimental design that examines a sample of athletes. Under supervision, each participant receives a banana – this is how the independent variable is measured.

Then they can let off steam during the workout and afterwards their muscle regeneration, the dependent variable, is measured.

In this experiment, the independent variable can now be varied, this is also referred to as “manipulation”.

3 example experiments

Example #1

For an experiment, the temperature inside a car is changed. People sitting in the car indicate how they feel at each temperature. Temperature is the independent variable. The dependent variable is the reported well-being of the occupants.

Example #2

You want to investigate how smartphone usage affects heart rate. The independent variable is smartphone usage and the dependent variable is heart rate.

Example #3

You want to find out how time spent working from home affects the work performance of your employees. In this example, the independent variable is time spent working from home and the dependent variable is work performance.

dependent and independent variables shribe

Dependent and independent variables in cross-sectional studies

In an experiment, data is collected at different times. This allows the study director to manipulate the independent variable.

In studies that only collect data from different individuals at a single point in time, this is not the case. This is also referred to as cross-sectional studies. An example of this is an online survey.

Here, variables cannot be manipulated and thus no causal relationships can be tested. The terminology of independent and dependent variables would therefore be incorrect. Nevertheless, everyone knows what is meant when you talk about it, but if you want to be completely correct, you can use

Predictor variable or prognostic variable instead of independent variable and

Response variable instead of dependent variable in speaking or writing.

After all, predictions about variables are also made in cross-sectional studies – only causality is not assumed.

If you’re interested, the difference between causality and correlation has been discussed in another video that you can find linked on the top right.

For experiments, this designation also works. You could therefore theoretically always use the designation predictor variable and response variable – independent and dependent only in the context of experiments (Field, 2015).

Measuring

Of course, the method is of the utmost importance here. For a quantitative study design, as already mentioned, experiments or standardized surveys such as online surveys can be used. But also collecting sensor data or other measurements or collecting documents, texts or social media data can be the basis for a quantitative research design.

Each method now produces data that has different levels of measurement or scale levels. These scale levels, if you will, decide the quality of your variables and what statistical operations are available to you to test your hypothesis.

dependent and independent variables article

Reliability and Validity of measuring variables

It is important to note that in order to make accurate inferences and conclusions, variables must be measured in a reliable and valid manner. Reliability refers to the consistency of measurement, while validity refers to the accuracy of measurement. For example, if you are measuring the number of organic fruits sold in a supermarket, it is important that the counting method is consistent and accurate.

If your variables are metric scaled, i.e. they consist of numerical values (e.g. number of bananas eaten), then the relationship (depending on the data, causal or correlational) between the dependent and independent variable can be calculated using a regression analysis.

Variables for regression analysis

Exactly how to do this is a topic for another video – but at least you now have a small glimpse of what you can do after determining and measuring your variables.

I hope this was helpful and if you want to delve further into this topic, I recommend the textbooks by Andy Field.